Rogers 2015 Annual Report Download - page 58
Download and view the complete annual report
Please find page 58 of the 2015 Rogers annual report below. You can navigate through the pages in the report by either clicking on the pages listed below, or by using the keyword search tool below to find specific information within the annual report.-
 1
1 -
2
-
3
-
4
-
5
-
6
-
7
-
8
-
9
-
10
-
11
-
12
-
13
-
14
-
15
-
16
-
17
-
18
-
19
-
20
-
21
-
22
-
23
-
24
-
25
-
26
-
27
-
28
-
29
-
30
-
31
-
32
-
33
-
34
-
35
-
36
-
37
-
38
-
39
-
40
-
41
-
42
-
43
-
44
-
45
-
46
-
47
-
 48
48 -
 49
49 -
 50
50 -
 51
51 -
 52
52 -
 53
53 -
 54
54 -
 55
55 -
 56
56 -
 57
57 -
 58
58 -
 59
59 -
 60
60 -
 61
61 -
 62
62 -
 63
63 -
 64
64 -
 65
65 -
 66
66 -
 67
67 -
 68
68 -
69
-
70
-
71
-
72
-
73
-
74
-
75
-
76
-
77
-
78
-
79
-
80
-
81
-
82
-
83
-
84
-
85
-
86
-
87
-
88
-
89
-
90
-
91
-
92
-
93
-
94
-
95
-
96
-
97
-
98
-
99
-
100
-
101
-
102
-
103
-
104
-
105
-
106
-
107
-
108
-
109
-
110
-
111
-
112
-
113
-
114
-
115
-
116
-
117
-
118
-
119
-
120
-
121
-
122
-
123
-
124
-
125
-
126
-
127
-
128
-
129
-
130
-
131
-
132
-
133
-
134
-
135
-
136
-
137
-
138
-
139
-
140
-
141
-
142
-
143
-
144
-
145
-
146
 |
 |

MANAGEMENT’S DISCUSSION AND ANALYSIS
OVERVIEW OF FINANCIAL POSITION
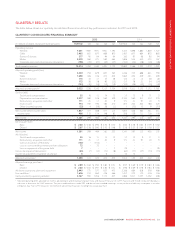
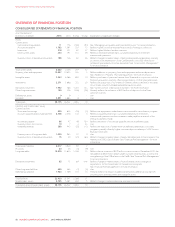
CONSOLIDATED STATEMENTS OF FINANCIAL POSITION
As at December 31
(In millions of dollars) 2015 2014 $ Chg % Chg Explanation of significant changes
Assets
Current assets:
Cash and cash equivalents 11 176 (165) (94) See “Managing our Liquidity and Financial Resources” for more information.
Accounts receivable 1,792 1,591 201 13 Reflects higher subscriber receivables as a result of timing of collections.
Inventories 318 251 67 27 Reflects higher Wireless handset inventory.
Other current assets 303 191 112 59 Reflects a receivable pertaining to our planned divestiture of Glentel’s
international operations.
Current portion of derivative instruments 198 136 62 46 Reflects changes in market values of debt and expenditure derivatives primarily
as a result of the depreciation of the Cdn$ relative to the US$, offset by the
settlement and maturity of certain derivatives. See “Financial Risk Management”
for more information.
Total current assets 2,622 2,345 277 12
Property, plant and equipment 10,997 10,655 342 3 Reflects additions to property, plant and equipment and asset depreciation.
See “Additions to Property, Plant and Equipment” for more information.
Intangible assets 7,243 6,588 655 10 Reflects purchases of spectrum licences from Shaw and in conjunction with the
Mobilicity acquisition, partially offset by amortization of other intangible assets.
Investments 2,271 1,898 373 20 Reflects the acquisition of our interest in Glentel, offset by declines in the value
of our shares in publicly traded marketable equity securities.
Derivative instruments 1,992 788 1,204 153 See “Current portion of derivative instruments” for more information.
Other long-term assets 150 356 (206) (58) Primarily reflects the utilization of $250 million of deposits for the Shaw
spectrum licences.
Deferred tax assets 99– –n/m
Goodwill 3,891 3,883 8 – n/m
Total assets 29,175 26,522 2,653 10
Liabilities and shareholders’ equity
Current liabilities:
Short-term borrowings 800 842 (42) (5) Reflects net repayments under the accounts receivable securitization program.
Accounts payable and accrued liabilities 2,708 2,578 130 5 Reflects a payable pertaining to our planned divestiture of Glentel’s
international operations and an increase in trade payables as a result of the
timing of payments made.
Income tax payable 96 47 49 104 Reflects the excess of income tax payable over tax installments paid.
Current portion of provisions 10 7343n/m
Unearned revenue 388 443 (55) (12) Reflects the reduction of certain revenue deferrals pertaining to our loyalty
programs, partially offset by higher customer deposits relating to 2016 Toronto
Blue Jays ticket sales.
Current portion of long-term debt 1,000 963 37 4 n/m
Current portion of derivative instruments 15 40 (25) (63) Reflects changes in market values of equity derivatives due to the increase in the
market price of RCI Class B shares. See “Financial Risk Management” for more
information.
Total current liabilities 5,017 4,920 97 2
Provisions 50 55 (5) (9) n/m
Long-term debt 15,870 13,824 2,046 15 Reflects the net issuance of $279 million in senior notes in December 2015, the
net additional $500 million drawn under our bank credit facilities, as well as the
strengthening of the US$ relative to the Cdn$. See “Financial Risk Management”
for more information.
Derivative instruments 95 11 84 n/m Reflects changes in market values of bond forwards, due to changes in
expectations for the Government of Canada borrowing rate.
See “Financial Risk Management” for more information.
Other long-term liabilities 455 462 (7) (2) n/m
Deferred tax liabilities 1,943 1,769 174 10 Primarily reflects the impact of additional temporary differences arising from
property, plant and equipment and intangible assets.
Total liabilities 23,430 21,041 2,389 11
Shareholders’ equity 5,745 5,481 264 5 Reflects changes in retained earnings and equity reserves.
Total liabilities and shareholders’ equity 29,175 26,522 2,653 10
56 ROGERS COMMUNICATIONS INC. 2015 ANNUAL REPORT