Rogers 2015 Annual Report Download - page 4
Download and view the complete annual report
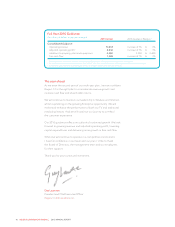
Please find page 4 of the 2015 Rogers annual report below. You can navigate through the pages in the report by either clicking on the pages listed below, or by using the keyword search tool below to find specific information within the annual report.-
 1
1 -
 2
2 -
 3
3 -
 4
4 -
 5
5 -
 6
6 -
 7
7 -
 8
8 -
 9
9 -
 10
10 -
 11
11 -
 12
12 -
 13
13 -
 14
14 -
 15
15 -
16
-
17
-
18
-
19
-
20
-
21
-
22
-
23
-
24
-
25
-
26
-
27
-
28
-
29
-
30
-
31
-
32
-
33
-
34
-
35
-
36
-
37
-
38
-
39
-
40
-
41
-
42
-
43
-
44
-
45
-
46
-
47
-
48
-
49
-
50
-
51
-
52
-
53
-
54
-
55
-
56
-
57
-
58
-
59
-
60
-
61
-
62
-
63
-
64
-
65
-
66
-
67
-
68
-
69
-
70
-
71
-
72
-
73
-
74
-
75
-
76
-
77
-
78
-
79
-
80
-
81
-
82
-
83
-
84
-
85
-
86
-
87
-
88
-
89
-
90
-
91
-
92
-
93
-
94
-
95
-
96
-
97
-
98
-
99
-
100
-
101
-
102
-
103
-
104
-
105
-
106
-
107
-
108
-
109
-
110
-
111
-
112
-
113
-
114
-
115
-
116
-
117
-
118
-
119
-
120
-
121
-
122
-
123
-
124
-
125
-
126
-
127
-
128
-
129
-
130
-
131
-
132
-
133
-
134
-
135
-
136
-
137
-
138
-
139
-
140
-
141
-
142
-
143
-
144
-
145
-
146
 |
 |

2 ROGERS COMMUNICATIONS INC. 2015 ANNUAL REPORT
2015 2014 2013 2012 2011
Operating revenue 13,414 12,850 12,706 12,486 12,346
Adjusted operating profit 1 5,032 5,019 4,993 4,834 4,739
Adjusted operating profit margin 1 38% 39% 39% 39% 38%
Free cash flow 1 1,676 1,437 1,548 1,649 1,874
Annualized dividend rate at year-end $1.92 $1.83 $1.74 $1.58 $1.42
Adjusted net income 1 1,490 1,532 1,769 1,781 1,736
Adjusted basic earnings per share 1 $2.89 $2.97 $3.43 $3.43 $3.20
Total assets 29,175 26,522 23,601 19,618 18,362
Return on assets 4.7% 5.1% 7.1% 8.6% 8.5%
Long-term debt (includes current portion) 16,870 14,787 13,343 10,789 10,034
Shareholders’ equity 5,745 5,481 4,669 3,768 3,572
Wireless subscribers (000s) 9,877 9,450 9,503 9,437 9,335
Internet subscribers (000s) 2,048 2,011 1,961 1,864 1,793
Television subscribers (000s) 1,896 2,024 2,127 2,214 2,297
Phone subscribers (000s) 1,090 1,150 1,153 1,074 1,052
Number of employees (approximate) 26,000 27,000 28,000 27,000 29,000
1 For a definition of these measures (which are “Non-GAAP”) see “Non-GAAP Measures” in Management’s Discussion and Analysis.
(In millions of dollars, except margins, per share
amounts, subscriber and employee data)
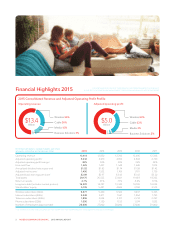
Wireless 63%
Media 3%
Business Solutions 2%
$5.0
Billion Cable 32%
$13.4
Billion
Wireless 56%
Cable 26%
Media 15%
Business Solutions 3%
FOR A DETAILED DISCUSSION OF OUR FINANCIAL AND OPERATING METRICS AND RESULTS,
PLEASE SEE THE ACCOMPANYING MANAGEMENT’S DISCUSSION AND ANALYSIS LATER IN THIS REPORT.Financial Highlights 2015
2015 Consolidated Revenue and Adjusted Operating Profit Profile
Operating revenue Adjusted operating profit