Rogers 2015 Annual Report Download - page 135
Download and view the complete annual report
Please find page 135 of the 2015 Rogers annual report below. You can navigate through the pages in the report by either clicking on the pages listed below, or by using the keyword search tool below to find specific information within the annual report.-
 1
1 -
2
-
3
-
4
-
5
-
6
-
7
-
8
-
9
-
10
-
11
-
12
-
13
-
14
-
15
-
16
-
17
-
18
-
19
-
20
-
21
-
22
-
23
-
24
-
25
-
26
-
27
-
28
-
29
-
30
-
31
-
32
-
33
-
34
-
35
-
36
-
37
-
38
-
39
-
40
-
41
-
42
-
43
-
44
-
45
-
46
-
47
-
48
-
49
-
50
-
51
-
52
-
53
-
54
-
55
-
56
-
57
-
58
-
59
-
60
-
61
-
62
-
63
-
64
-
65
-
66
-
67
-
68
-
69
-
70
-
71
-
72
-
73
-
74
-
75
-
76
-
77
-
78
-
79
-
80
-
81
-
82
-
83
-
84
-
85
-
86
-
87
-
88
-
89
-
90
-
91
-
92
-
93
-
94
-
95
-
96
-
97
-
98
-
99
-
100
-
101
-
102
-
103
-
104
-
105
-
106
-
107
-
108
-
109
-
110
-
111
-
112
-
113
-
114
-
115
-
116
-
117
-
118
-
119
-
120
-
121
-
122
-
123
-
124
-
 125
125 -
 126
126 -
 127
127 -
 128
128 -
 129
129 -
 130
130 -
 131
131 -
 132
132 -
 133
133 -
 134
134 -
 135
135 -
 136
136 -
 137
137 -
 138
138 -
 139
139 -
 140
140 -
 141
141 -
 142
142 -
 143
143 -
 144
144 -
 145
145 -
146
 |
 |

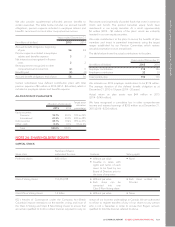
NOTES TO CONSOLIDATED FINANCIAL STATEMENTS
NOTE 26: BUSINESS COMBINATIONS
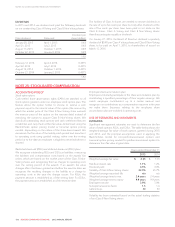
ACCOUNTING POLICY
We account for acquisitions of subsidiaries using the acquisition
method of accounting. We calculate the fair value of the
consideration paid as the sum of the fair value at the date of
acquisition of the assets we transferred and the equity interests we
issued, less the liabilities we assumed to acquire the subsidiary.
We measure goodwill as the fair value of the consideration
transferred less the net recognized amount of the identifiable
assets acquired and liabilities assumed, which are generally
measured at fair value as of the acquisition date. When the excess
is negative, a gain on acquisition is recognized immediately in net
income.
We expense the transaction costs associated with acquisitions as
we incur them.
USE OF ESTIMATES AND JUDGMENTS
ESTIMATES
We use estimates to determine the fair values of assets acquired
and liabilities assumed, using the best available information,
including information from financial markets. These estimates
include key assumptions such as discount rates, attrition rates, and
terminal growth rates for performing discounted cash flow
analyses.
EXPLANATORY INFORMATION
We made several acquisitions in 2015 and 2014, which we
describe below. Goodwill recognized in the 2015 and in the 2014
dealer store acquisitions was deductible for tax purposes; goodwill
recognized on all other acquisitions was not tax-deductible.
Goodwill represents the expected operational synergies with the
business acquired and/or intangible assets that do not qualify to be
recognized separately.
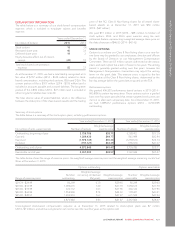
2015 ACQUISITIONS
Mobilicity
In July 2015, we completed the acquisition of 100% of the
outstanding common shares of Mobilicity for cash consideration of
$443 million. Mobilicity provided wireless telecommunication
services to Canadians in Toronto, Ottawa, Calgary, Edmonton, and
Vancouver to its prepaid subscribers and owned AWS-1 spectrum
licences.
Subsequent to the acquisition of Mobilicity, Rogers and WIND
undertook an AWS-1 spectrum licence asset exchange in Southern
Ontario to create an additional 10 MHz of contiguous, paired
AWS-1 spectrum for Rogers. In addition, Rogers transferred certain
non-contiguous AWS-1 spectrum licences previously held by
Mobilicity in British Columbia, Alberta, and various regions in
OntariotoWINDfornominalcashproceeds.
Prior to the date of acquisition, Mobilicity was protected under the
Companies’ Creditors Arrangement Act and the acquisition date
fair value of the net identifiable assets exceeded the consideration
paid, resulting in a gain on acquisition of $102 million. This
acquisition provided an enhanced spectrum licence position and
tax losses to the Company.
Other
In 2015, we completed other individually immaterial acquisitions
for total cash consideration of $33 million.
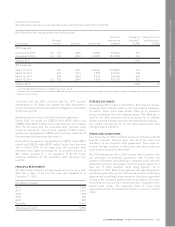
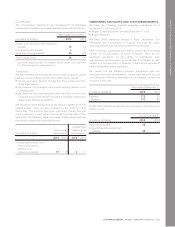
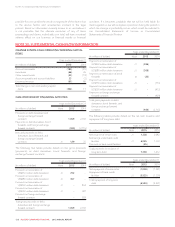
Final fair values of assets acquired and liabilities assumed
The table below summarizes the final fair values of the assets
acquired and liabilities assumed for all the acquisitions described
above.
(In millions of dollars) Mobilicity Other Total
Fair value of consideration
transferred 443 33 476
Net identifiable asset or liability:
Current assets 5 3 8
Property, plant and
equipment 11 6 17
Spectrum licences 458 – 458
Customer relationships 1–1919
Deferred tax assets 175 – 175
Current liabilities (31) (2) (33)
Other liabilities (8) – (8)
Deferred tax liabilities (65) (1) (66)
Fair value of net identifiable assets
acquired and liabilities assumed 545 25 570
(Gain on acquisition) goodwill (102) 8
Acquisition transaction costs 16 – 16
1Customer relationships are amortized over a period of seven years.
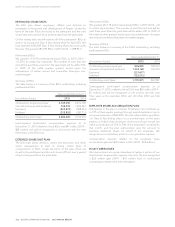
The table below shows the incremental revenue and net loss
before taxes for the Mobilicity acquisition since the date of
acquisition to December 31, 2015.
(In millions of dollars) Mobilicity
Incremental revenue 30
Net loss before taxes 117
1Includes acquisition transaction costs of $16 million.
PRO FORMA DISCLOSURES
If the Mobilicity acquisition had occurred on January 1, 2015, we
estimate our incremental revenue from the acquisition would have
been $59 million and income before income taxes would have
decreased by $17 million for the year ended December 31, 2015.
The pro forma disclosures are based on estimates and assumptions
we believe are reasonable. The information provided is not
necessarily an indication of what our consolidated financial results
will be in the future.
2014 ACQUISITIONS
Dealer stores
In January 2014, we completed an asset acquisition of certain
dealer stores located in British Columbia, Alberta, and Ontario for
cash consideration of $46 million, which was paid as a deposit in
the fourth quarter of 2013. The dealer stores are a retail distribution
2015 ANNUAL REPORT ROGERS COMMUNICATIONS INC. 133