Rogers 2015 Annual Report Download - page 54
Download and view the complete annual report
Please find page 54 of the 2015 Rogers annual report below. You can navigate through the pages in the report by either clicking on the pages listed below, or by using the keyword search tool below to find specific information within the annual report.-
 1
1 -
2
-
3
-
4
-
5
-
6
-
7
-
8
-
9
-
10
-
11
-
12
-
13
-
14
-
15
-
16
-
17
-
18
-
19
-
20
-
21
-
22
-
23
-
24
-
25
-
26
-
27
-
28
-
29
-
30
-
31
-
32
-
33
-
34
-
35
-
36
-
37
-
38
-
39
-
40
-
41
-
42
-
43
-
 44
44 -
 45
45 -
 46
46 -
 47
47 -
 48
48 -
 49
49 -
 50
50 -
 51
51 -
 52
52 -
 53
53 -
 54
54 -
 55
55 -
 56
56 -
 57
57 -
 58
58 -
 59
59 -
 60
60 -
 61
61 -
 62
62 -
 63
63 -
 64
64 -
65
-
66
-
67
-
68
-
69
-
70
-
71
-
72
-
73
-
74
-
75
-
76
-
77
-
78
-
79
-
80
-
81
-
82
-
83
-
84
-
85
-
86
-
87
-
88
-
89
-
90
-
91
-
92
-
93
-
94
-
95
-
96
-
97
-
98
-
99
-
100
-
101
-
102
-
103
-
104
-
105
-
106
-
107
-
108
-
109
-
110
-
111
-
112
-
113
-
114
-
115
-
116
-
117
-
118
-
119
-
120
-
121
-
122
-
123
-
124
-
125
-
126
-
127
-
128
-
129
-
130
-
131
-
132
-
133
-
134
-
135
-
136
-
137
-
138
-
139
-
140
-
141
-
142
-
143
-
144
-
145
-
146
 |
 |

MANAGEMENT’S DISCUSSION AND ANALYSIS
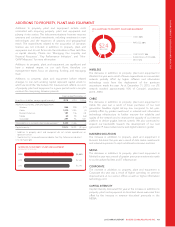
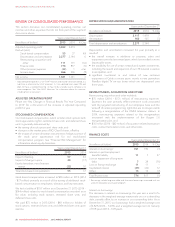
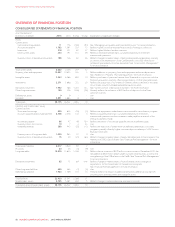
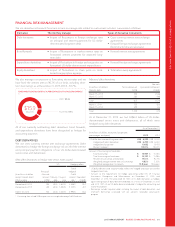
ADJUSTED NET INCOME
Excluding certain items, adjusted net income was 3% lower
compared to 2014, mainly as a result of higher depreciation and
amortization, partially offset by higher adjusted operating profit,
lower finance costs, and lower income taxes.
Years ended December 31
(In millions of dollars, except per share
amounts) 2015 2014 % Chg
Adjusted operating profit 15,032 5,019 –
Deduct (add):
Depreciation and amortization 2,277 2,144 6
Finance costs 2767 788 (3)
Other (income) expense 3(2) 1n/m
Income taxes 4500 554 (10)
Adjusted net income 11,490 1,532 (3)
Adjusted basic earnings per share 1$2.89 $2.97 (3)
Adjusted diluted earnings per share 1$2.88 $2.96 (3)
1Adjusted operating profit, adjusted net income, and adjusted basic and diluted
earnings per share are non-GAAP measures and should not be considered as a
substitute or alternative for GAAP measures. They are not defined terms under IFRS,
and do not have standard meanings, so may not be a reliable way to compare us to
other companies. See “Non-GAAP Measures” for information about these measures,
including how we calculate them.
2Finance costs exclude the $7 million loss on repayment of long-term debt for the year
ended December 31, 2015 (2014 – $29 million loss).
3Other (income) expense excludes a $102 million gain on acquisition of Mobilicity and
a $72 million loss related to our share of an obligation to purchase at fair value the
non-controlling interest in one of our joint ventures.
4Income taxes exclude the $40 million recovery (2014 – $62 million recovery) for the
year ended December 31, 2015 related to income tax impact for adjusted items. For
2015, income taxes also exclude the $6 million expense for the revaluation of
deferred tax balances due to legislative income tax rate changes. For 2014, income
taxes also exclude the $14 million expense adjusting previously recognized Ontario
harmonization transitional tax credits.
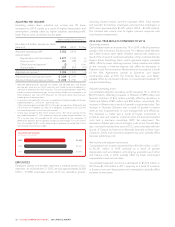
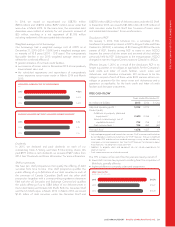
(IN MILLIONS OF DOLLARS)
ADJUSTED NET INCOME
2015
2014
2013
$1,490
$1,532
$1,769
EMPLOYEES
Employee salaries and benefits represent a material portion of our
expenses. As at December 31, 2015, we had approximately 26,000
(2014 – 27,000) employees across all of our operating groups,
including shared services and the corporate office. Total salaries
and benefits for full-time employees and part-time employees in
2015 were approximately $1,975 million (2014 – $1,940 million).
The increase was mainly due to higher pension expenses and
stock-based compensation.
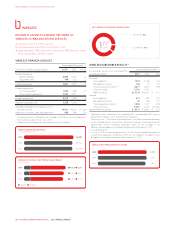
2014 FULL YEAR RESULTS COMPARED TO 2013
Operating revenue
Consolidated revenue increased by 1% in 2014, reflecting revenue
growth of 2% in Business Solutions and 7% in Media, while Wireless
and Cable revenue were stable. Wireless revenue was stable as a
result of the impact of continued adoption of the customer-friendly
Rogers Share Everything plans, which generate higher postpaid
ARPA, offset by lower roaming revenue. Cable revenue was stable
as the increase in Internet revenue was offset by decreases in
Television and Phone revenue. Media revenue increased as a result
of the NHL Agreement, growth at Sportsnet, and higher
merchandise sales at TSC, the Toronto Blue Jays, and Radio,
partially offset by continued softness in conventional broadcast TV
and print advertising.
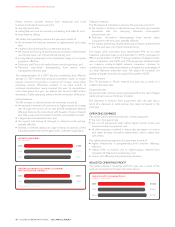
Adjusted operating profit
Consolidated adjusted operating profit increased 1% in 2014 to
$5,019 million, reflecting increases in Wireless of $89 million and
Business Solutions of $16 million, partially offset by decreases in
Cable and Media of $53 million and $30 million, respectively. The
increase in Wireless was a result of growth in equipment sales. The
increase in Business Solutions was a result of growth in service
revenue and improvements in cost management and efficiency.
ThedecreaseinCablewasaresultofhigherinvestmentsin
customer care and network, customer value enhancement-related
costs and a one-time cumulative CRTC fee adjustment. The
decrease in Media was a result of higher costs at the Toronto Blue
Jays, increased merchandise costs at TSC, costs associated with the
launch of Texture by Next Issue (formerly branded as Next Issue
Canada in 2014), and increased programming costs, partially offset
by lower publishing costs.
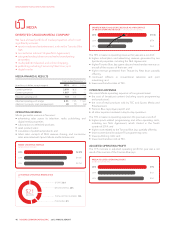
Net income and adjusted net income
Consolidated net income decreased from $1,669 million in 2013
to $1,341 million in 2014 primarily as a result of greater
depreciation and amortization, restructuring, acquisition and other
and finance costs in 2014, partially offset by lower stock-based
compensation and income taxes.
Consolidated adjusted net income decreased to $1,532 million in
2014 from $1,769 million in 2013, primarily as a result of increases
in finance costs and depreciation and amortization, partially offset
by lower income taxes.
52 ROGERS COMMUNICATIONS INC. 2015 ANNUAL REPORT