Rogers 2015 Annual Report Download - page 121
Download and view the complete annual report
Please find page 121 of the 2015 Rogers annual report below. You can navigate through the pages in the report by either clicking on the pages listed below, or by using the keyword search tool below to find specific information within the annual report.-
 1
1 -
2
-
3
-
4
-
5
-
6
-
7
-
8
-
9
-
10
-
11
-
12
-
13
-
14
-
15
-
16
-
17
-
18
-
19
-
20
-
21
-
22
-
23
-
24
-
25
-
26
-
27
-
28
-
29
-
30
-
31
-
32
-
33
-
34
-
35
-
36
-
37
-
38
-
39
-
40
-
41
-
42
-
43
-
44
-
45
-
46
-
47
-
48
-
49
-
50
-
51
-
52
-
53
-
54
-
55
-
56
-
57
-
58
-
59
-
60
-
61
-
62
-
63
-
64
-
65
-
66
-
67
-
68
-
69
-
70
-
71
-
72
-
73
-
74
-
75
-
76
-
77
-
78
-
79
-
80
-
81
-
82
-
83
-
84
-
85
-
86
-
87
-
88
-
89
-
90
-
91
-
92
-
93
-
94
-
95
-
96
-
97
-
98
-
99
-
100
-
101
-
102
-
103
-
104
-
105
-
106
-
107
-
108
-
109
-
110
-
 111
111 -
 112
112 -
 113
113 -
 114
114 -
 115
115 -
 116
116 -
 117
117 -
 118
118 -
 119
119 -
 120
120 -
 121
121 -
 122
122 -
 123
123 -
 124
124 -
 125
125 -
 126
126 -
 127
127 -
 128
128 -
 129
129 -
 130
130 -
 131
131 -
132
-
133
-
134
-
135
-
136
-
137
-
138
-
139
-
140
-
141
-
142
-
143
-
144
-
145
-
146
 |
 |

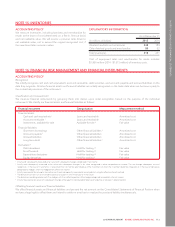
NOTES TO CONSOLIDATED FINANCIAL STATEMENTS
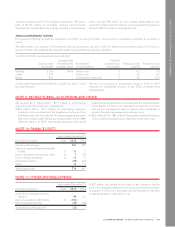
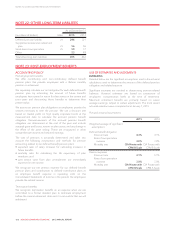
Bond forwards
During 2015, we did not enter into any new bond forwards.
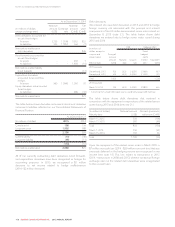
ThetablebelowshowsthebondforwardswehaveenteredintotohedgetheunderlyingGovernmentofCanada(GoC)10-yearratefor
anticipated future debt.
(In millions of dollars, except interest rates)
GoC term (years) Effective date Maturity date 1
Notional
amount
Hedged GoC
interest rate as at
December 31, 2015
Hedged GoC
interest rate as at
December 31, 2014 12015 2014
10 December 2014 December 31, 2015 500 – 2.05% –500
10 December 2014 January 4, 2017 500 2.34% 2.04% 500 500
10 December 2014 April 30, 2018 500 2.23% 2.07% 500 500
30 December 2014 December 31, 2018 400 2.52% 2.41% 400 400
Total 1,900 1,400 1,900
1Bond forwards with maturity dates beyond December 31, 2015 are subject to GoC rate re-setting from time to time. The $500 million due in April 2018 was extended in October
2015 to reset in April 2016. The $500 million due in January 2017 was extended in December 2015 to reset in January 2017. The $400 million due December 2018 was extended
in December 2015 to reset in January 2017.
On December 8, 2015, we exercised the $500 million notional
bond forward due December 31, 2015 in relation to the issuance
of the US$700 million senior notes due 2025 and paid $25 million
to settle the derivative. The amount paid represents the fair value of
the bond forward at the time of settlement and will be amortized to
finance costs over the life of the US$700 million senior notes due
2025.
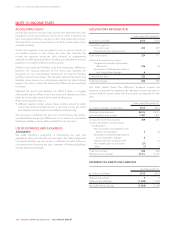
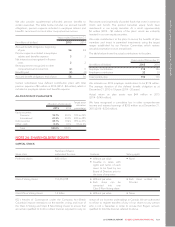
Expenditure derivatives
The table below shows the expenditure derivatives into which we
entered to manage foreign exchange risk related to certain
forecasted expenditures.
(In millions of dollars, except exchange rates)
Notional trade date Maturity dates
Notional
amount
(US$)
Exchange
rate
Converted
notional
amount
(Cdn$)
April 2015 July 2015 to
December 2016 270 1.2222 330
June 2015 January 2016 to
December 2016 60 1.2167 73
September 2015 January 2016 to
December 2016 360 1.3194 475
October 2015 January 2017 to
December 2017 300 1.2933 388
Total during 2015 990 1.2788 1,266
February 2014 January 2015 to
April 2015 200 1.1100 222
May 2014 May 2015 to
December 2015 232 1.0948 254
June 2014 January 2015 to
December 2015 288 1.0903 314
July 2014 January 2016 to
December 2016 240 1.0833 260
Total during 2014 960 1.0940 1,050
As at December 31, 2015, we had US$1,140 million of expenditure
derivatives outstanding (2014 – US$960 million), at an average rate
of $1.24/US$ (2014 – $1.09/US$). During the year ended
December 31, 2015, we settled US$810 million
(2014 – US$900 million) of expenditure derivatives for $902 million
(2014 – $923 million).
Equity derivatives
In 2013, we entered into equity derivatives to hedge market price
appreciation risk associated of 5.7 million RCI Class B Non-Voting
shares that have been granted under our stock-based
compensation programs for stock options, restricted share units
(RSUs) and deferred share units (DSUs) (see note 25). The equity
derivatives were entered into at a weighted average price of
$50.37 with original terms to maturity of one year, extendible for
further one year periods with the consent of the hedge
counterparties. In 2015, we executed extension agreements for
each of our equity derivative contracts under substantially the same
committed terms and conditions with revised expiry dates of April
2016 (from April 2015). The equity derivatives have not been
designated as hedges for accounting purposes.
During 2015, we recognized a recovery, net of interest receipts, of
$22 million (2014 – $10 million expense), in stock-based
compensation expense related to the change in fair value of our
equity derivative contracts net of received payments. As of
December 31, 2015, the fair value of the equity derivatives was a
liability of $15 million (2014 – $30 million), which is included in the
current portion of derivative instruments liabilities.
2015 ANNUAL REPORT ROGERS COMMUNICATIONS INC. 119