Rogers 2015 Annual Report Download - page 52
Download and view the complete annual report
Please find page 52 of the 2015 Rogers annual report below. You can navigate through the pages in the report by either clicking on the pages listed below, or by using the keyword search tool below to find specific information within the annual report.-
 1
1 -
2
-
3
-
4
-
5
-
6
-
7
-
8
-
9
-
10
-
11
-
12
-
13
-
14
-
15
-
16
-
17
-
18
-
19
-
20
-
21
-
22
-
23
-
24
-
25
-
26
-
27
-
28
-
29
-
30
-
31
-
32
-
33
-
34
-
35
-
36
-
37
-
38
-
39
-
40
-
41
-
 42
42 -
 43
43 -
 44
44 -
 45
45 -
 46
46 -
 47
47 -
 48
48 -
 49
49 -
 50
50 -
 51
51 -
 52
52 -
 53
53 -
 54
54 -
 55
55 -
 56
56 -
 57
57 -
 58
58 -
 59
59 -
 60
60 -
 61
61 -
 62
62 -
63
-
64
-
65
-
66
-
67
-
68
-
69
-
70
-
71
-
72
-
73
-
74
-
75
-
76
-
77
-
78
-
79
-
80
-
81
-
82
-
83
-
84
-
85
-
86
-
87
-
88
-
89
-
90
-
91
-
92
-
93
-
94
-
95
-
96
-
97
-
98
-
99
-
100
-
101
-
102
-
103
-
104
-
105
-
106
-
107
-
108
-
109
-
110
-
111
-
112
-
113
-
114
-
115
-
116
-
117
-
118
-
119
-
120
-
121
-
122
-
123
-
124
-
125
-
126
-
127
-
128
-
129
-
130
-
131
-
132
-
133
-
134
-
135
-
136
-
137
-
138
-
139
-
140
-
141
-
142
-
143
-
144
-
145
-
146
 |
 |

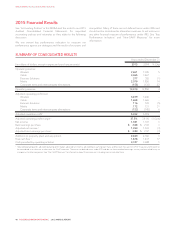
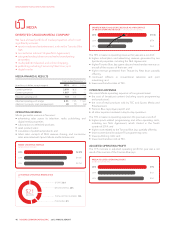
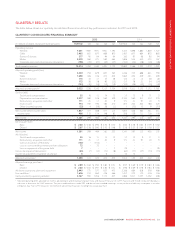
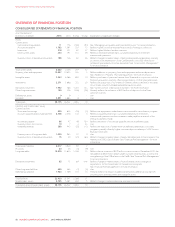
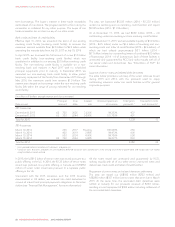
MANAGEMENT’S DISCUSSION AND ANALYSIS
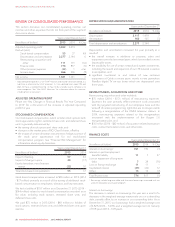
REVIEW OF CONSOLIDATED PERFORMANCE
This section discusses our consolidated operating income, net
income, and other expenses that do not form part of the segment
discussions above.
Years ended December 31
(In millions of dollars) 2015 2014 % Chg
Adjusted operating profit 15,032 5,019 –
Deduct (add):
Stock-based compensation 55 37 49
Depreciation and amortization 2,277 2,144 6
Restructuring, acquisition and
other 111 173 (36)
Finance costs 774 817 (5)
Other (income) expense (32) 1n/m
Income taxes 466 506 (8)
Net income 1,381 1,341 3
1Adjusted operating profit is a non-GAAP measure and should not be considered as a
substitute or alternative for GAAP measures. It is not a defined term under IFRS and
does not have a standard meaning, so may not be a reliable way to compare us to
other companies. See “Non-GAAP Measures” for information about this measure,
including how we calculate it.
ADJUSTED OPERATING PROFIT
Please see “Key Changes in Financial Results This Year Compared
to 2014” for a discussion of the increase in adjusted operating
profit this year.
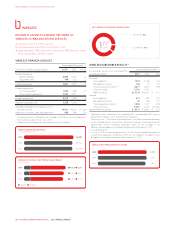
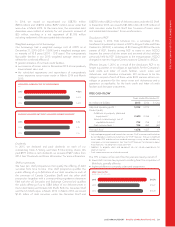
STOCK-BASED COMPENSATION
Our stock-based compensation, which includes stock options (with
stock appreciation rights), restricted share units, and deferred share
units, is generally determined by:
• the vesting of stock options and share units; and
• changes in the market price of RCI Class B shares; offset by
• the impact of certain derivative instruments to hedge a portion of
the stock price appreciation risk for our stock-based
compensation program. See “Financial Risk Management” for
information about equity derivatives.
Years ended December 31
(In millions of dollars) 2015 2014
Impact of vesting 57 44
Impact of change in price 20 (17)
Equity derivatives, net of interest
receipt (22) 10
Total stock-based compensation 55 37
Stock-based compensation increased to $55 million in 2015 (2014
- $37 million) primarily as a result of the vesting of additional stock-
based compensation to employees, directors, and key executives.
We had a liability of $157 million as at December 31, 2015 (2014 –
$144 million) related to stock-based compensation recorded at its
fair value, including stock options, restricted share units, and
deferred share units.
We paid $73 million in 2015 (2014 – $48 million) to holders of
stock options, restricted share units, and deferred share units upon
exercise.
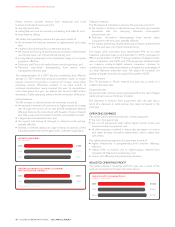
DEPRECIATION AND AMORTIZATION
Years ended December 31
(In millions of dollars) 2015 2014 % Chg
Depreciation 2,117 1,979 7
Amortization 160 165 (3)
Total depreciation and amortization 2,277 2,144 6
Depreciation and amortization increased this year primarily as a
result of:
• the overall increase in additions to property, plant and
equipment over the last several years, which has resulted in more
depreciable assets;
• the availability for use of certain network and system investments,
including the launch and expansion of our LTE network in various
municipalities; and
• significant investment in, and rollout of, new customer
equipment at Cable in recent years, mostly in next generation
NextBox digital TV set-top boxes which are depreciated over
three years.
RESTRUCTURING, ACQUISITION AND OTHER
Restructuring, acquisition and other included:
• $75 million (2014 – $131 million) of restructuring expenses.
Expenses this year primarily reflect severance costs associated
with the targeted restructuring of our employee base and the
write-off of certain programming rights that are no longer usable
following a reorganization of the OMNI television stations. In
2014, restructuring expenses related to the reorganization
associated with the implementation of the Rogers 3.0
reorganization plan; and
• $36 million (2014 – $42 million) of acquisition-related transaction
costs, contract termination costs, and other costs.
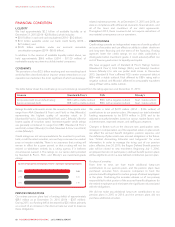
FINANCE COSTS
Years ended December 31
(In millions of dollars) 2015 2014 % Chg
Interest on borrowings 1761 782 (3)
Interest on post-employment
benefits liability 11 757
Loss on repayment of long-term
debt 729 (76)
Loss on foreign exchange 11 11 –
Capitalized interest (29) (26) 12
Other 13 14 (7)
Total finance costs 774 817 (5)
1Borrowings include long-term debt and short-term borrowings associated with our
accounts receivable securitization program.
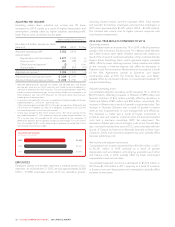
Interest on borrowings
The decrease in interest on borrowings this year was a result of a
decrease in the weighted average interest rate on our outstanding
debt, partially offset by an increase in our outstanding debt. As at
December 31, 2015, our borrowings had a weighted average cost
of 4.82% (2014 – 5.20%) and a weighted average term to maturity
of 10.8 years (2014 – 10.8 years).
50 ROGERS COMMUNICATIONS INC. 2015 ANNUAL REPORT