Rogers 2015 Annual Report Download - page 90
Download and view the complete annual report
Please find page 90 of the 2015 Rogers annual report below. You can navigate through the pages in the report by either clicking on the pages listed below, or by using the keyword search tool below to find specific information within the annual report.-
 1
1 -
2
-
3
-
4
-
5
-
6
-
7
-
8
-
9
-
10
-
11
-
12
-
13
-
14
-
15
-
16
-
17
-
18
-
19
-
20
-
21
-
22
-
23
-
24
-
25
-
26
-
27
-
28
-
29
-
30
-
31
-
32
-
33
-
34
-
35
-
36
-
37
-
38
-
39
-
40
-
41
-
42
-
43
-
44
-
45
-
46
-
47
-
48
-
49
-
50
-
51
-
52
-
53
-
54
-
55
-
56
-
57
-
58
-
59
-
60
-
61
-
62
-
63
-
64
-
65
-
66
-
67
-
68
-
69
-
70
-
71
-
72
-
73
-
74
-
75
-
76
-
77
-
78
-
79
-
 80
80 -
 81
81 -
 82
82 -
 83
83 -
 84
84 -
 85
85 -
 86
86 -
 87
87 -
 88
88 -
 89
89 -
 90
90 -
 91
91 -
 92
92 -
 93
93 -
 94
94 -
 95
95 -
 96
96 -
 97
97 -
 98
98 -
 99
99 -
 100
100 -
101
-
102
-
103
-
104
-
105
-
106
-
107
-
108
-
109
-
110
-
111
-
112
-
113
-
114
-
115
-
116
-
117
-
118
-
119
-
120
-
121
-
122
-
123
-
124
-
125
-
126
-
127
-
128
-
129
-
130
-
131
-
132
-
133
-
134
-
135
-
136
-
137
-
138
-
139
-
140
-
141
-
142
-
143
-
144
-
145
-
146
 |
 |

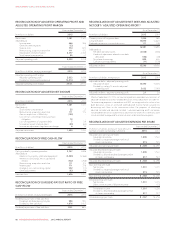
MANAGEMENT’S DISCUSSION AND ANALYSIS
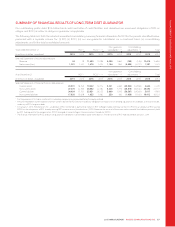
FIVE-YEAR SUMMARY OF CONSOLIDATED FINANCIAL RESULTS
(In millions of dollars, except per share amounts, subscriber count
results, ARPA, ARPU, churn, percentages, and ratios)
As at or years ended December 31
2015 2014 2013 2012 2011
Income and cash flow:
Operating revenue
Wireless 7,651 7,305 7,270 7,280 7,138
Cable 3,465 3,467 3,475 3,358 3,309
Business Solutions 377 382 374 351 405
Media 2,079 1,826 1,704 1,620 1,611
Corporate items and intercompany eliminations (158) (130) (117) (123) (117)
Total operating revenue 13,414 12,850 12,706 12,486 12,346
Adjusted operating profit 1
Wireless 3,239 3,246 3,157 3,063 3,036
Cable 1,658 1,665 1,718 1,605 1,549
Business Solutions 116 122 106 89 86
Media 172 131 161 190 180
Corporate items and intercompany eliminations (153) (145) (149) (113) (112)
Total adjusted operating profit 5,032 5,019 4,993 4,834 4,739
Net income from continuing operations 1,381 1,341 1,669 1,725 1,590
Net income 1,381 1,341 1,669 1,693 1,563
Adjusted net income from continuing operations 11,490 1,532 1,769 1,781 1,736
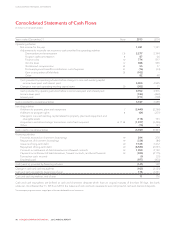
Cash provided by operating activities 3,747 3,698 3,990 3,421 3,791
Free cash flow 11,676 1,437 1,548 1,649 1,874
Additions to property, plant and equipment 2,440 2,366 2,240 2,142 2,127
Earnings per share from continuing operations
Basic $2.68 $ 2.60 $ 3.24 $ 3.32 $ 2.93
Diluted $2.67 $ 2.56 $ 3.22 $ 3.30 $ 2.91
Earnings per share
Basic $2.68 $ 2.60 $ 3.24 $ 3.26 $ 2.88
Diluted $2.67 $ 2.56 $ 3.22 $ 3.24 $ 2.86
Adjusted earnings per share 1
Basic $2.89 $ 2.97 $ 3.43 $ 3.43 $ 3.20
Diluted $2.88 $ 2.96 $ 3.42 $ 3.41 $ 3.17
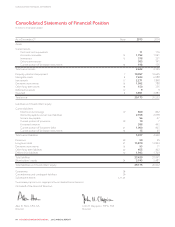
Statements of Financial Position:
Assets
Property, plant and equipment, net 10,997 10,655 10,255 9,576 9,114
Goodwill 3,891 3,883 3,751 3,215 3,280
Intangible assets 7,243 6,588 3,211 2,951 2,721
Investments 2,271 1,898 1,487 1,484 1,107
Other assets 4,773 3,498 4,897 2,392 2,140
Total assets 29,175 26,522 23,601 19,618 18,362
Liabilities and Shareholders’ Equity
Long-term liabilities 18,413 16,121 14,326 12,848 12,241
Current liabilities 5,017 4,920 4,606 3,002 2,549
Total liabilities 23,430 21,041 18,932 15,850 14,790
Shareholders’ equity 5,745 5,481 4,669 3,768 3,572
Total liabilities and shareholders’ equity 29,175 26,522 23,601 19,618 18,362
Subscriber count results (000s): 2
Wireless subscribers 9,877 9,450 9,503 9,437 9,335
Internet subscribers 2,048 2,011 1,961 1,864 1,793
Television subscribers 1,896 2,024 2,127 2,214 2,297
Phone subscribers 1,090 1,150 1,153 1,074 1,052
Additional Wireless metrics: 2
Postpaid churn (monthly) 1.27% 1.27% 1.24% 1.29% 1.32%
Postpaid ARPA (monthly) 3$110.74 $106.41
Blended ARPU (monthly) $ 59.71 $ 59.41 $ 59.58 $ 59.79 $ 60.20
Ratios:
Revenue growth 4% 1% 2% 1% 3%
Adjusted operating profit growth 0% 1% 3% 2% 2%
Dividends declared per share $1.92 $ 1.83 $ 1.74 $ 1.58 $ 1.42
Dividend payout ratio of net income 272% 70% 54% 48% 49%
Dividend payout ratio of free cash flow 1,2 59% 66% 58% 50% 41%
Return on assets 24.7% 5.1% 7.1% 8.6% 8.5%
Adjusted net debt / adjusted operating profit 13.1 2.9 2.3 2.3 2.2
1Adjusted operating profit, adjusted net income, adjusted basic and diluted earnings per share, free cash flow, adjusted net debt, adjusted net debt / adjusted operating profit,
and dividend payout ratio of free cash flow are non-GAAP measures and should not be considered as a substitute or alternative for GAAP measures. These are not defined terms
under IFRS, and do not have standard meanings, so may not be a reliable way to compare us to other companies. See “Non-GAAP Measures” for information about these
measures, including how we calculate them.
2As defined. See “Key Performance Indicators”.
3Postpaid ARPA has not been presented for periods prior to 2014. We commenced reporting postpaid ARPA as a key performance indicator in the first quarter of 2015. See “Key
Performance Indicators”.
88 ROGERS COMMUNICATIONS INC. 2015 ANNUAL REPORT