Rogers 2015 Annual Report Download - page 133
Download and view the complete annual report
Please find page 133 of the 2015 Rogers annual report below. You can navigate through the pages in the report by either clicking on the pages listed below, or by using the keyword search tool below to find specific information within the annual report.-
 1
1 -
2
-
3
-
4
-
5
-
6
-
7
-
8
-
9
-
10
-
11
-
12
-
13
-
14
-
15
-
16
-
17
-
18
-
19
-
20
-
21
-
22
-
23
-
24
-
25
-
26
-
27
-
28
-
29
-
30
-
31
-
32
-
33
-
34
-
35
-
36
-
37
-
38
-
39
-
40
-
41
-
42
-
43
-
44
-
45
-
46
-
47
-
48
-
49
-
50
-
51
-
52
-
53
-
54
-
55
-
56
-
57
-
58
-
59
-
60
-
61
-
62
-
63
-
64
-
65
-
66
-
67
-
68
-
69
-
70
-
71
-
72
-
73
-
74
-
75
-
76
-
77
-
78
-
79
-
80
-
81
-
82
-
83
-
84
-
85
-
86
-
87
-
88
-
89
-
90
-
91
-
92
-
93
-
94
-
95
-
96
-
97
-
98
-
99
-
100
-
101
-
102
-
103
-
104
-
105
-
106
-
107
-
108
-
109
-
110
-
111
-
112
-
113
-
114
-
115
-
116
-
117
-
118
-
119
-
120
-
121
-
122
-
 123
123 -
 124
124 -
 125
125 -
 126
126 -
 127
127 -
 128
128 -
 129
129 -
 130
130 -
 131
131 -
 132
132 -
 133
133 -
 134
134 -
 135
135 -
 136
136 -
 137
137 -
 138
138 -
 139
139 -
 140
140 -
 141
141 -
 142
142 -
 143
143 -
144
-
145
-
146
 |
 |

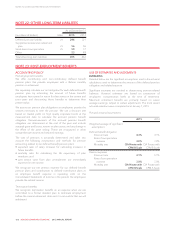
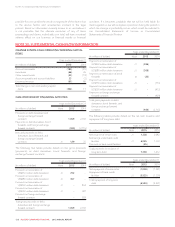
NOTES TO CONSOLIDATED FINANCIAL STATEMENTS
EXPLANATORY INFORMATION
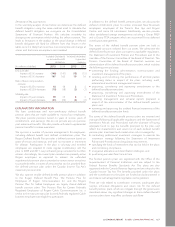
The table below is a summary of our stock-based compensation
expense, which is included in employee salaries and benefits
expense.
Years ended December 31
(In millions of dollars) 2015 2014
Stock options 18 (9)
Restricted share units 40 34
Deferred share units 19 2
Equity derivative effect, net of interest
receipt (22) 10
Total stock-based compensation
expense 55 37
As at December 31, 2015, we had a total liability recognized at its
fair value of $157 million (2014 – $144 million) related to stock-
based compensation, including stock options, RSUs and DSUs. The
current portion of this is $107 million (2014 – $106 million) and is
included in accounts payable and accrued liabilities. The long-term
portion of this is $50 million (2014 – $37 million) and is included in
other long-term liabilities (see note 22).
The total intrinsic value of vested liabilities, which is the difference
between the strike price of the share-based awards and the trading
price of the RCI Class B Non-Voting shares for all vested share-
based awards as at December 31, 2015 was $56 million
(2014 – $67 million).
We paid $73 million in 2015 (2014 – $48 million) to holders of
stock options, RSUs, and DSUs upon exercise using the cash
settlement feature, representing a weighted average share price on
the date of exercise of $46.63 (2014 – $43.42).
STOCK OPTIONS
Options to purchase our Class B Non-Voting shares on a one-for-
one basis may be granted to our employees, directors and officers
by the Board of Directors or our Management Compensation
Committee. There are 65 million options authorized under various
plans, and each option has a term of seven to ten years. The vesting
period is generally graded vesting over four years; however the
Management Compensation Committee may adjust the vesting
terms on the grant date. The exercise price is equal to the fair
market value of the Class B Non-Voting shares, determined as the
five-day average before the grant date as quoted on the TSX.
Performance options
We granted 496,200 performance-based options in 2015 (2014 –
845,989) to certain key executives. These options vest on a graded
basis over four years provided that certain targeted stock prices are
met on or after each anniversary date. As at December 31, 2015,
we had 3,688,612 performance options (2014 – 4,740,308)
outstanding.
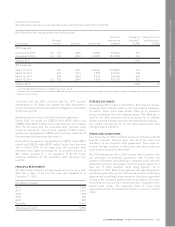
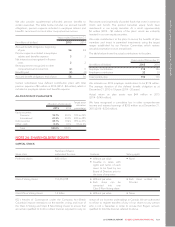
Summary of stock options
The table below is a summary of the stock option plans, including performance options:
Year ended December 31, 2015 Year ended December 31, 2014
(In number of units, except prices) Number of options
Weighted average
exercise price Number of options
Weighted average
exercise price
Outstanding, beginning of year 5,759,786 $38.71 6,368,403 $37.39
Granted 1,289,430 $44.77 845,989 $42.94
Exercised (1,978,149) $35.40 (1,259,533) $34.14
Forfeited (197,127) $43.49 (195,073) $43.37
Outstanding, end of year 4,873,940 $41.47 5,759,786 $38.71
Exercisable, end of year 2,457,005 $38.57 3,363,046 $35.47
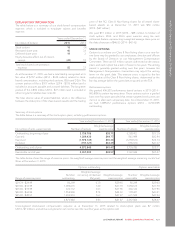
The table below shows the range of exercise prices, the weighted average exercise price and the weighted average remaining contractual
life as at December 31, 2015:
Options outstanding Options exercisable
Range of exercise prices
Number
outstanding
Weighted average
remaining contractual
life (years)
Weighted average
exercise price
Number
exercisable
Weighted average
exercise price
$29.39 – $29.99 86,299 0.30 $29.40 86,299 $29.40
$30.00 – $34.99 1,094,635 1.40 $33.70 1,094,635 $33.70
$35.00 – $39.99 630,132 3.03 $37.96 466,126 $37.96
$40.00 – $44.99 1,859,900 8.74 $44.03 178,421 $43.01
$45.00 – $48.57 1,202,974 7.63 $47.27 631,524 $47.44
4,873,940 5.93 $41.47 2,457,005 $38.57
Unrecognized stock-based compensation expense as at December 31, 2015 related to stock-option plans was $7 million
(2014 – $7 million), and will be recognized in net income over the next four years as the options vest.
2015 ANNUAL REPORT ROGERS COMMUNICATIONS INC. 131