Rogers 2015 Annual Report Download - page 130
Download and view the complete annual report
Please find page 130 of the 2015 Rogers annual report below. You can navigate through the pages in the report by either clicking on the pages listed below, or by using the keyword search tool below to find specific information within the annual report.-
 1
1 -
2
-
3
-
4
-
5
-
6
-
7
-
8
-
9
-
10
-
11
-
12
-
13
-
14
-
15
-
16
-
17
-
18
-
19
-
20
-
21
-
22
-
23
-
24
-
25
-
26
-
27
-
28
-
29
-
30
-
31
-
32
-
33
-
34
-
35
-
36
-
37
-
38
-
39
-
40
-
41
-
42
-
43
-
44
-
45
-
46
-
47
-
48
-
49
-
50
-
51
-
52
-
53
-
54
-
55
-
56
-
57
-
58
-
59
-
60
-
61
-
62
-
63
-
64
-
65
-
66
-
67
-
68
-
69
-
70
-
71
-
72
-
73
-
74
-
75
-
76
-
77
-
78
-
79
-
80
-
81
-
82
-
83
-
84
-
85
-
86
-
87
-
88
-
89
-
90
-
91
-
92
-
93
-
94
-
95
-
96
-
97
-
98
-
99
-
100
-
101
-
102
-
103
-
104
-
105
-
106
-
107
-
108
-
109
-
110
-
111
-
112
-
113
-
114
-
115
-
116
-
117
-
118
-
119
-
 120
120 -
 121
121 -
 122
122 -
 123
123 -
 124
124 -
 125
125 -
 126
126 -
 127
127 -
 128
128 -
 129
129 -
 130
130 -
 131
131 -
 132
132 -
 133
133 -
 134
134 -
 135
135 -
 136
136 -
 137
137 -
 138
138 -
 139
139 -
 140
140 -
141
-
142
-
143
-
144
-
145
-
146
 |
 |

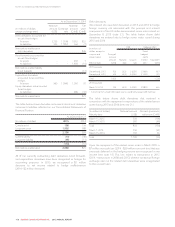
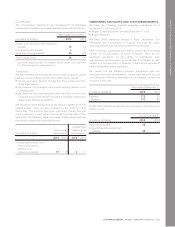
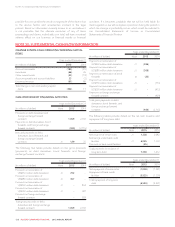
NOTES TO CONSOLIDATED FINANCIAL STATEMENTS
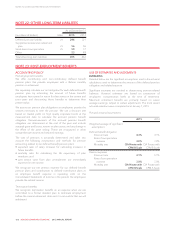
The table below sets out the estimated present value of accrued
plan benefits and the estimated market value of the net assets
available to provide these benefits for our funded plans.
As at December 31
(In millions of dollars) 2015 2014
Plan assets, at fair value 1,432 1,285
Accrued benefit obligations (1,713) (1,592)
Deficiency of plan assets over accrued benefit
obligations (281) (307)
Effect of asset ceiling limit (3) (7)
Net deferred pension liability (284) (314)
Consists of:
Deferred pension asset 12 7
Deferred pension liability (296) (321)
Net deferred pension liability (284) (314)
The table below shows our pension fund assets.
Years ended December 31
(In millions of dollars) 2015 2014
Plan assets, beginning of year 1,285 1,037
Interest income 56 57
Remeasurements, (loss) return on plan
assets recognized in other
comprehensive (loss) income
and equity (10) 94
Contributions by employees 32 30
Contributions by employer 118 106
Benefits paid (46) (37)
Administrative expenses paid from
plan assets (3) (2)
Plan assets, end of year 1,432 1,285
The table below shows the accrued benefit obligations arising from
funded obligations.
Years ended December 31
(In millions of dollars) 2015 2014
Accrued benefit obligations, beginning
of year 1,592 1,209
Service cost 98 70
Interest cost 65 61
Benefits paid (46) (37)
Contributions by employees 32 30
Remeasurements, recognized in other
comprehensive (income) loss
and equity (28) 259
Accrued benefit obligations, end of
year 1,713 1,592
Thetablebelowshowstheeffectoftheassetceiling.
Years ended December 31
(In millions of dollars) 2015 2014
Asset ceiling, beginning of year (7) (9)
Interest (1) (1)
Remeasurements, change in asset
ceiling (excluding interest income) 53
Asset ceiling, end of year (3) (7)
Plan assets are comprised mainly of pooled funds that invest in
common stocks and bonds that are traded in an active market. The
table below shows the fair value of the total pension plan assets by
major category.
As at December 31
(In millions of dollars) 2015 2014
Equity securities 873 774
Debt securities 554 506
Other – cash 55
Total fair value of plan assets 1,432 1,285
The table below shows our net pension expense. Net interest cost
is included in finance costs and other pension expenses are
included in salaries and benefits expense in operating costs on the
Consolidated Statements of Income.
Years ended December 31
(In millions of dollars) 2015 2014
Plan cost:
Service cost 98 70
Net interest cost 94
Net pension expense 107 74
Administrative expense 32
Total pension cost recognized in net
income 110 76
Net interest cost, a component of the plan cost above is included in
finance costs and is outlined as follows:
Years ended December 31
(In millions of dollars) 2015 2014
Net interest cost:
Interest income on plan assets (56) (57)
Interest cost on plan obligation 65 61
Netinterestcostrecognizedinfinance
costs 94
The remeasurement recognized in other comprehensive income, is
determined as follows:
Years ended December 31
(In millions of dollars) 2015 2014
(Loss) return on plan assets (excluding
interest income) (10) 94
Change in financial assumptions 45 (265)
Change in demographic assumptions –15
Effect of experience adjustments (17) (9)
Change in asset ceiling 42
Remeasurement recognized in other
comprehensive income (loss) and
equity 22 (163)
128 ROGERS COMMUNICATIONS INC. 2015 ANNUAL REPORT