Rogers 2015 Annual Report Download - page 47
Download and view the complete annual report
Please find page 47 of the 2015 Rogers annual report below. You can navigate through the pages in the report by either clicking on the pages listed below, or by using the keyword search tool below to find specific information within the annual report.
MANAGEMENT’S DISCUSSION AND ANALYSIS
CABLE
ONE OF CANADA’S LEADING PROVIDERS OF HIGH-
SPEED INTERNET, CABLE TELEVISION, AND PHONE
SERVICES
As at December 31, 2015, we had:
• approximately 2.0 million high-speed Internet subscribers;
• approximately 1.9 million Television subscribers –
approximately 31% of Canadian cable television subscribers;
• approximately 1.1 million Phone subscribers; and
• a network that passes approximately 4.2 million homes in
Ontario, New Brunswick, and Newfoundland.
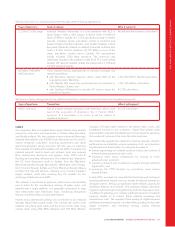
CABLE FINANCIAL RESULTS
Years ended December 31
(In millions of dollars, except margins) 2015 12014 % Chg
Operating revenue
Internet 1,343 1,245 8
Television 1,669 1,734 (4)
Phone 445 478 (7)
Service revenue 3,457 3,457 –
Equipment sales 810 (20)
Operating revenue 3,465 3,467 –
Operating expenses
Cost of equipment 46 (33)
Other operating expenses 1,803 1,796 –
Operating expenses 1,807 1,802 –
Adjusted operating profit 1,658 1,665 –
Adjusted operating profit margin 47.8% 48.0% (0.2 pts)
Additions to property, plant and equipment 1,030 1,055 (2)
1TheoperatingresultsofSourceCableareincludedintheCableresultsofoperations
from the date of acquisition on November 4, 2014.
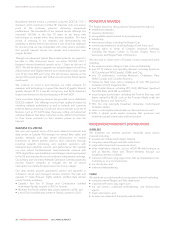
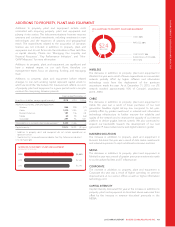
(IN MILLIONS OF DOLLARS)
CABLE OPERATING REVENUE
2015
2014
2013
$3,465
$3,467
$3,475
(IN MILLIONS OF DOLLARS)
CABLE SERVICE REVENUE BREAKDOWN
2015
2014
2013
445 1,343 1,669
478 1,245 1,734
498 1,159 1,809
TelevisionInternetPhone
(%)
2015 CABLE SERVICE REVENUE MIX
TELEVISION 48%
INTERNET 39%
PHONE 13%
$3.5
BILLION
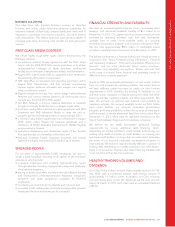
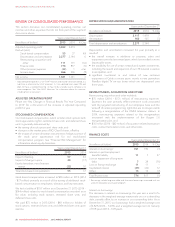
CABLE SUBSCRIBER RESULTS 1
Years ended December 31
(In thousands) 2015 2014 2Chg
Internet
Net additions 37 34 3
Total Internet subscribers 2,3 2,048 2,011 37
Television
Net losses (128) (119) (9)
Total Television subscribers 2,3 1,896 2,024 (128)
Phone
Net losses (60) (14) (46)
Total Phone subscribers 2,3 1,090 1,150 (60)
Cable homes passed 2,3 4,153 4,068 85
Total service units 4
Net losses (151) (99) (52)
Total service units 2,3 5,034 5,185 (151)
1Subscriber count is a key performance indicator. See “Key Performance Indicators”.
2On November 4, 2014, we acquired approximately 16,000 cable high-speed Internet
subscribers, 16,000 Television subscribers, and 11,000 Phone subscribers from our
acquisition of Source Cable. These subscribers are not included in net additions, but
do appear in the ending total balance for December 31, 2014 and 2015. The
acquisition also increased homes passed by approximately 26,000.
3As at end of period.
4Includes Internet, Television, and Phone subscribers.
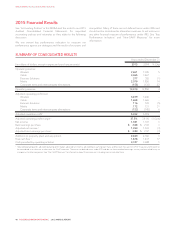
(IN THOUSANDS)
CABLE SUBSCRIBER BREAKDOWN
2015
TelevisionInternetPhone
2014
2013
1,090 2,048 1,896
1,150 2,011 2,024
1,153 1,961 2,127
OPERATING REVENUE
Internet revenue includes:
• monthly subscription and additional use service revenue from
residential, small business, and wholesale Internet access
subscribers; and
• modem rental fees.
Television revenue includes:
• digital and analog cable services – comprised of:
• basic cable service fees;
• tier service fees;
• access fees for use of channel capacity by third parties; and
• premium and specialty service subscription fees, including pay
per view service fees and video-on-demand service fees; and
• rentals of digital cable set-top boxes.
2015 ANNUAL REPORT ROGERS COMMUNICATIONS INC. 45


