Rogers 2015 Annual Report Download - page 88
Download and view the complete annual report
Please find page 88 of the 2015 Rogers annual report below. You can navigate through the pages in the report by either clicking on the pages listed below, or by using the keyword search tool below to find specific information within the annual report.-
 1
1 -
2
-
3
-
4
-
5
-
6
-
7
-
8
-
9
-
10
-
11
-
12
-
13
-
14
-
15
-
16
-
17
-
18
-
19
-
20
-
21
-
22
-
23
-
24
-
25
-
26
-
27
-
28
-
29
-
30
-
31
-
32
-
33
-
34
-
35
-
36
-
37
-
38
-
39
-
40
-
41
-
42
-
43
-
44
-
45
-
46
-
47
-
48
-
49
-
50
-
51
-
52
-
53
-
54
-
55
-
56
-
57
-
58
-
59
-
60
-
61
-
62
-
63
-
64
-
65
-
66
-
67
-
68
-
69
-
70
-
71
-
72
-
73
-
74
-
75
-
76
-
77
-
 78
78 -
 79
79 -
 80
80 -
 81
81 -
 82
82 -
 83
83 -
 84
84 -
 85
85 -
 86
86 -
 87
87 -
 88
88 -
 89
89 -
 90
90 -
 91
91 -
 92
92 -
 93
93 -
 94
94 -
 95
95 -
 96
96 -
 97
97 -
 98
98 -
99
-
100
-
101
-
102
-
103
-
104
-
105
-
106
-
107
-
108
-
109
-
110
-
111
-
112
-
113
-
114
-
115
-
116
-
117
-
118
-
119
-
120
-
121
-
122
-
123
-
124
-
125
-
126
-
127
-
128
-
129
-
130
-
131
-
132
-
133
-
134
-
135
-
136
-
137
-
138
-
139
-
140
-
141
-
142
-
143
-
144
-
145
-
146
 |
 |

MANAGEMENT’S DISCUSSION AND ANALYSIS
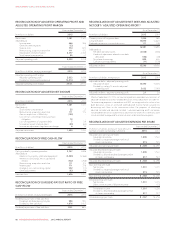
RECONCILIATION OF ADJUSTED OPERATING PROFIT AND
ADJUSTED OPERATING PROFIT MARGIN
Years ended December 31
(In millions of dollars) 2015 2014
Net income 1,381 1,341
Add (deduct):
Income taxes 466 506
Other (income) expense (32) 1
Finance costs 774 817
Restructuring, acquisition and other 111 173
Depreciation and amortization 2,277 2,144
Stock-based compensation 55 37
Adjusted operating profit 5,032 5,019
Years ended December 31
(In millions of dollars, except percentages) 2015 2014
Adjusted operating profit margin:
Adjusted operating profit 5,032 5,019
Divided by: total operating revenue 13,414 12,850
Adjusted operating profit margin 37.5% 39.1%
RECONCILIATION OF ADJUSTED NET INCOME
Years ended December 31
(In millions of dollars) 2015 2014
Net income 1,381 1,341
Add (deduct):
Stock-based compensation 55 37
Restructuring, acquisition and other 111 173
Gain on acquisition of Mobilicity (102) –
Loss on non-controlling interest purchase
obligation 72 –
Loss on repayment of long-term debt 729
Income tax impact of above items (40) (62)
Income tax adjustment, legislative tax change 614
Adjusted net income 1,490 1,532
RECONCILIATION OF FREE CASH FLOW
Years ended December 31
(In millions of dollars) 2015 2014
Cash provided by operating activities 3,747 3,698
Add (deduct):
Additions to property, plant and equipment (2,440) (2,366)
Interest on borrowings, net of capitalized
interest (732) (756)
Restructuring, acquisition and other 111 173
Interest paid 771 778
Change in non-cash working capital 302 (11)
Other adjustments (83) (79)
Free cash flow 1,676 1,437
RECONCILIATION OF DIVIDEND PAYOUT RATIO OF FREE
CASH FLOW
Years ended December 31
(In millions of dollars, except percentages) 2015 2014
Dividend payout ratio of free cash flow:
Dividends declared during the year 988 942
Divided by: free cash flow 1,676 1,437
Dividend payout ratio of free cash flow 59% 66%
RECONCILIATION OF ADJUSTED NET DEBT AND ADJUSTED
NET DEBT / ADJUSTED OPERATING PROFIT 1
As at December 31
(In millions of dollars) 2015 2014
Current portion of long-term debt 1,000 963
Long-term debt 15,870 13,824
Deferred transaction costs and discounts 111 108
16,981 14,895
Add (deduct):
Netdebtderivativeassets (2,028) (846)
Credit risk adjustment related to net debt
derivatives (152) (39)
Short-term borrowings 800 842
Cash and cash equivalents (11) (176)
Adjusted net debt 15,590 14,676
As at December 31
(In millions of dollars, except ratios) 2015 2014
Adjusted net debt / adjusted operating profit
Adjusted net debt 15,590 14,676
Divided by: trailing 12 months adjusted
operating profit 5,032 5,019
Adjusted net debt / adjusted operating profit 3.1 2.9
1Effective September 30, 2015, we have retrospectively amended our calculation of
adjusted net debt to value the net debt derivatives without adjustment for credit risk.
For accounting purposes in accordance with IFRS, we recognize the fair values of our
debt derivatives using an estimated credit-adjusted mark-to-market valuation by
discounting cash flows to the measurement date. For purposes of calculating
adjusted net debt and adjusted net debt / adjusted operating profit, we believe
including debt derivatives valued without adjustment for credit risk is commonly used
to evaluate debt leverage and for market valuation and transactional purposes.
RECONCILIATION OF ADJUSTED EARNINGS PER SHARE
(In millions of dollars, except per share amounts;
number of shares outstanding in millions)
Years ended December 31
2015 2014
Adjusted basic earnings per share:
Adjusted net income 1,490 1,532
Divided by: weighted average number of
shares outstanding 515 515
Adjusted basic earnings per share $2.89 $2.97
Adjusted diluted earnings per share:
Adjusted net income 1,490 1,532
Dividedby:dilutedweightedaveragenumber
of shares outstanding 517 517
Adjusted diluted earnings per share $2.88 $2.96
Basic earnings per share:
Net income 1,381 1,341
Divided by: weighted average number of
shares outstanding 515 515
Basic earnings per share $2.68 $2.60
Diluted earnings per share:
Net income 1,381 1,341
Effect on net income of dilutive securities –(15)
Diluted net income 1,381 1,326
Dividedby:dilutedweightedaveragenumber
of shares outstanding 517 517
Diluted earnings per share $2.67 $2.56
86 ROGERS COMMUNICATIONS INC. 2015 ANNUAL REPORT