Rogers 2015 Annual Report Download - page 65
Download and view the complete annual report
Please find page 65 of the 2015 Rogers annual report below. You can navigate through the pages in the report by either clicking on the pages listed below, or by using the keyword search tool below to find specific information within the annual report.-
 1
1 -
2
-
3
-
4
-
5
-
6
-
7
-
8
-
9
-
10
-
11
-
12
-
13
-
14
-
15
-
16
-
17
-
18
-
19
-
20
-
21
-
22
-
23
-
24
-
25
-
26
-
27
-
28
-
29
-
30
-
31
-
32
-
33
-
34
-
35
-
36
-
37
-
38
-
39
-
40
-
41
-
42
-
43
-
44
-
45
-
46
-
47
-
48
-
49
-
50
-
51
-
52
-
53
-
54
-
 55
55 -
 56
56 -
 57
57 -
 58
58 -
 59
59 -
 60
60 -
 61
61 -
 62
62 -
 63
63 -
 64
64 -
 65
65 -
 66
66 -
 67
67 -
 68
68 -
 69
69 -
 70
70 -
 71
71 -
 72
72 -
 73
73 -
 74
74 -
 75
75 -
76
-
77
-
78
-
79
-
80
-
81
-
82
-
83
-
84
-
85
-
86
-
87
-
88
-
89
-
90
-
91
-
92
-
93
-
94
-
95
-
96
-
97
-
98
-
99
-
100
-
101
-
102
-
103
-
104
-
105
-
106
-
107
-
108
-
109
-
110
-
111
-
112
-
113
-
114
-
115
-
116
-
117
-
118
-
119
-
120
-
121
-
122
-
123
-
124
-
125
-
126
-
127
-
128
-
129
-
130
-
131
-
132
-
133
-
134
-
135
-
136
-
137
-
138
-
139
-
140
-
141
-
142
-
143
-
144
-
145
-
146
 |
 |

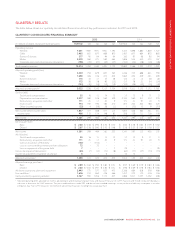
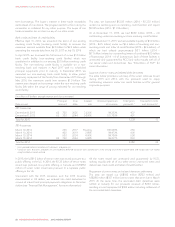
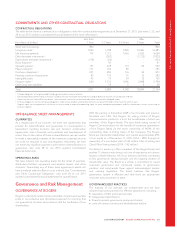
MANAGEMENT’S DISCUSSION AND ANALYSIS
MARK-TO-MARKET VALUE
We record our derivatives using an estimated credit-adjusted,
mark-to-market valuation, calculated in accordance with IFRS.
As at December 31, 2015
(In millions of dollars, except
exchange rates)
Notional
amount
(US$)
Exchange
rate
Notional
amount
(Cdn$)
Fair
value
(Cdn$)
Debt derivatives accounted for
as cash flow hedges:
As assets 5,900 1.0755 6,345 2,032
As liabilities 300 1.3367 401 (4)
Net mark-to-market asset
debt derivatives 2,028
Bond forwards accounted for
as cash flow hedges:
As liabilities – – 1,400 (91)
Expenditure derivatives
accounted for as cash flow
hedges:
As assets 1,140 1.2410 1,415 158
Equity derivatives not
accounted for as hedges:
As liabilities – – 286 (15)
Net mark-to-market asset 2,080
As at December 31, 2014
(In millions of dollars, except
exchange rates)
Notional
amount
(US$)
Exchange
rate
Notional
amount
(Cdn$)
Fair
value
(Cdn$)
Debt derivatives accounted for
as cash flow hedges:
As assets 5,725 1.0396 5,952 853
As liabilities 305 1.1857 362 (7)
Net mark-to-market asset
debt derivatives 846
Bond forwards accounted for as
cash flow hedges:
As assets – – 250 1
As liabilities – – 1,650 (14)
Net mark-to-market liability
bond forwards 1,900 (13)
Expenditure derivatives
accounted for as cash flow
hedges:
As assets 960 1.0940 1,050 70
Equity derivatives not
accounted for as hedges:
As liabilities – – 286 (30)
Net mark-to-market asset 873
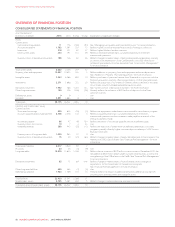
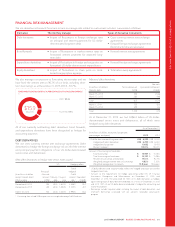
ADJUSTED NET DEBT AND ADJUSTED NET DEBT /
ADJUSTED OPERATING PROFIT
We use adjusted net debt and adjusted net debt / adjusted
operating profit to conduct valuation-related analysis and make
capital structure-related decisions. Adjusted net debt includes
long-term debt, net debt derivatives assets or liabilities, short-term
borrowings, and cash and cash equivalents.
As at December 31
(In millions of dollars, except ratios) 2015 2014
Long-term debt 116,981 14,895
Net debt derivative assets valued without
any adjustment for credit risk 2(2,180) (885)
Short-term borrowings 800 842
Cash and cash equivalents (11) (176)
Adjusted net debt 315,590 14,676
Adjusted net debt / adjusted operating
profit 3, 4 3.1 2.9
1Includes current and long-term portion of long-term debt before the reduction in
carrying value arising from purchase accounting and deferred transaction costs and
discounts. See “Reconciliation of adjusted net debt” in the section “Non-GAAP
Measures” for the calculation of this amount.
2Effective September 30, 2015, we retrospectively amended our calculation of
adjusted net debt to value the net debt derivatives without adjustment for credit risk.
For accounting purposes in accordance with IFRS, we recognize the fair values of our
debt derivatives using an estimated credit-adjusted mark-to-market valuation by
discounting cash flows to the measurement date. For purposes of calculating
adjusted net debt and adjusted net debt / adjusted operating profit, we believe
including debt derivatives valued without adjustment for credit risk is commonly used
to evaluate debt leverage and for market valuation and transactional purposes. As at
December 31, 2015, the net debt derivative assets presented in the table above
consist of the credit-adjusted net debt derivative assets of $2,028 million (2014 –
$846 million) and the credit risk adjustment of $152 million (2014 – $39 million).
3Adjusted net debt and adjusted net debt / adjusted operating profit are non-GAAP
measures and should not be considered as a substitute or alternative for GAAP
measures. These are not defined terms under IFRS and do not have standard
meanings, so may not be a reliable way to compare us to other companies. See
“Non-GAAP Measures” for information about these measures, including how we
calculate them.
4Adjusted net debt / adjusted operating profit is measured using adjusted operating
profit for the last 12 consecutive months.
In addition to the cash and cash equivalents as at December 31,
2015 noted above, we held $966 million of marketable equity
securities in publicly traded companies as at December 31, 2015
(2014 – $1,130 million).
Our adjusted net debt increased by $914 million this year and our
adjusted net debt / adjusted operating profit increased to 3.1. This
increase is primarily attributable to our acquisitions and investments
made in 2015. Our long-term target for adjusted net debt /
adjusted operating profit remains a range of 2.0 to 2.5.
2015 ANNUAL REPORT ROGERS COMMUNICATIONS INC. 63