Rogers 2015 Annual Report Download - page 37
Download and view the complete annual report
Please find page 37 of the 2015 Rogers annual report below. You can navigate through the pages in the report by either clicking on the pages listed below, or by using the keyword search tool below to find specific information within the annual report.-
 1
1 -
2
-
3
-
4
-
5
-
6
-
7
-
8
-
9
-
10
-
11
-
12
-
13
-
14
-
15
-
16
-
17
-
18
-
19
-
20
-
21
-
22
-
23
-
24
-
25
-
26
-
 27
27 -
 28
28 -
 29
29 -
 30
30 -
 31
31 -
 32
32 -
 33
33 -
 34
34 -
 35
35 -
 36
36 -
 37
37 -
 38
38 -
 39
39 -
 40
40 -
 41
41 -
 42
42 -
 43
43 -
 44
44 -
 45
45 -
 46
46 -
 47
47 -
48
-
49
-
50
-
51
-
52
-
53
-
54
-
55
-
56
-
57
-
58
-
59
-
60
-
61
-
62
-
63
-
64
-
65
-
66
-
67
-
68
-
69
-
70
-
71
-
72
-
73
-
74
-
75
-
76
-
77
-
78
-
79
-
80
-
81
-
82
-
83
-
84
-
85
-
86
-
87
-
88
-
89
-
90
-
91
-
92
-
93
-
94
-
95
-
96
-
97
-
98
-
99
-
100
-
101
-
102
-
103
-
104
-
105
-
106
-
107
-
108
-
109
-
110
-
111
-
112
-
113
-
114
-
115
-
116
-
117
-
118
-
119
-
120
-
121
-
122
-
123
-
124
-
125
-
126
-
127
-
128
-
129
-
130
-
131
-
132
-
133
-
134
-
135
-
136
-
137
-
138
-
139
-
140
-
141
-
142
-
143
-
144
-
145
-
146
 |
 |

MANAGEMENT’S DISCUSSION AND ANALYSIS
FINANCIAL AND OPERATING GUIDANCE
We provide consolidated annual guidance ranges for selected financial metrics on a consolidated basis consistent with the annual plans
approved by our Board.
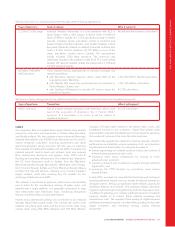
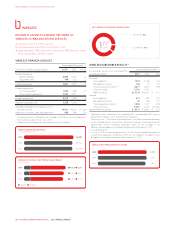
2015 ACHIEVEMENTS AGAINST GUIDANCE
The following table outlines guidance ranges that we had
previously provided and our actual results and achievements for the
selected full year 2015 financial metrics.
(In millions of dollars)
2015
Guidance
2015
Actual Achievement
Consolidated Guidance 1
Adjusted operating profit 25,020 to 5,175 5,032 ✓
Additions to property,
plant and equipment 32,350 to 2,450 2,440 ✓
Free cash flow 21,525 to 1,675 1,676 ✓✓
Achieved ✓Exceeded ✓✓
1The above table outlines guidance ranges for selected full-year 2015 consolidated
financial metrics provided in our January 29, 2015 earnings release and subsequently
updated on July 23, 2015 to increase our free cash flow guidance by $175 million,
which reflected the value of tax loss carry forwards acquired as part of the Mobilicity
transaction that closed on July 2, 2015.
2Adjusted operating profit and free cash flow are non-GAAP measures and should not
be considered as a substitute or alternative for GAAP measures. These are not
defined terms under IFRS and do not have standard meanings, so may not be a
reliable way to compare us to other companies. See “Non-GAAP Measures” for
information about these measures, including how we calculate them.
3Includes additions to property, plant and equipment for the Wireless, Cable, Business
Solutions, Media, and Corporate segments and does not include expenditures on
spectrum licences.
2016 FULL YEAR CONSOLIDATED GUIDANCE
We expect steady growth in operating revenue and adjusted
operating profit and lower additions to property, plant and
equipment to drive higher free cash flow. We expect to have the
financial flexibility to maintain our network advantages, to begin
reducing debt, and to continue to return cash to shareholders.
(In millions of dollars, except
percentages)
2015
Actual
2016 Guidance
Ranges 1
Consolidated Guidance
Operating revenue 13,414 Increase of 1% to 3%
Adjusted operating profit 25,032 Increase of 1% to 3%
Additions to property, plant
and equipment 32,440 2,300 to 2,400
Free cash flow 21,676 Increase of 1% to 3%
1Guidance ranges presented as percentages reflect percentage increases over 2015
actual results.
2Adjusted operating profit and free cash flow are non-GAAP measures and should not
be considered as a substitute or alternative for GAAP measures. These are not
defined terms under IFRS and do not have standard meanings, so may not be a
reliable way to compare us to other companies. See “Non-GAAP Measures” for
information about these measures, including how we calculate them.
3Includes additions to property, plant and equipment for the Wireless, Cable, Business
Solutions, Media and Corporate segments, and does not include expenditures on
spectrum licences.
The above table outlines guidance ranges for selected full year
2016 consolidated financial metrics. These ranges take into
consideration our current outlook and our actual results for 2015.
The purpose of the financial outlook is to assist investors,
shareholders, and others in understanding certain financial metrics
relating to expected 2016 financial results for evaluating the
performance of our business. This information may not be
appropriate for other purposes. Information about our guidance,
including the various assumptions underlying it, is forward-looking
and should be read in conjunction with “About Forward-Looking
Information”, “Risks and Uncertainties Affecting Our Business”, and
the related disclosure and information about various economic,
competitive, and regulatory assumptions, factors, and risks that may
cause our actual future financial and operating results to differ from
what we currently expect.
We provide annual guidance ranges on a consolidated full-year
basis, which are consistent with annual full-year Board-approved
plans. Any updates to our full-year financial guidance over the
course of the year would only be made to the consolidated
guidance ranges that appear above.
Key underlying assumptions
Our 2016 guidance ranges above are based on many assumptions
including, but not limited to, the following material assumptions:
• continued intense competition in all segments in which we
operate;
• a substantial portion of our US dollar-denominated expenditures
has been hedged at an average exchange rate of $1.22/US$;
• key interest rates will remain relatively stable throughout 2016;
• no significant additional regulatory developments, shifts in
economic conditions, or macro changes in the competitive
environment affecting our business activities. We note that
regulatory decisions expected during 2016 could materially alter
underlying assumptions around our 2016 Wireless, Cable,
Business Solutions, and/or Media results in the current and future
years, the impacts of which are currently unknown and not
factored into our guidance;
• the CRTC decision to require distributors to offer a basic entry-
level television package capped at $25 per month, as well as
channels above the basic tier on an “à la carte” basis or in
smaller, reasonably priced packages by March 1, 2016, and both
“à la carte” and in smaller, reasonably priced packages by
December 1, 2016, is not expected to materially impact our
Cable operating revenue;
• Wireless customers will continue to adopt, and upgrade to,
higher-value smartphones and a similar proportion of customers
will remain on term contracts;
• overall wireless market penetration in Canada is expected to
grow in 2016 at a similar rate as in 2015;
• continued subscriber growth in Wireless and Cable Internet;
moderating net losses in Cable Television and Home Phone
subscribers;
• in Business Solutions, continued declines in our legacy and off-
net business, and the continued execution of our plan to grow
higher-margin next generation IP- and cloud-based services;
• in Media, continued growth in Sportsnet and declines in our
traditional media businesses; and
2015 ANNUAL REPORT ROGERS COMMUNICATIONS INC. 35