Rogers 2015 Annual Report Download - page 44
Download and view the complete annual report
Please find page 44 of the 2015 Rogers annual report below. You can navigate through the pages in the report by either clicking on the pages listed below, or by using the keyword search tool below to find specific information within the annual report.-
 1
1 -
2
-
3
-
4
-
5
-
6
-
7
-
8
-
9
-
10
-
11
-
12
-
13
-
14
-
15
-
16
-
17
-
18
-
19
-
20
-
21
-
22
-
23
-
24
-
25
-
26
-
27
-
28
-
29
-
30
-
31
-
32
-
33
-
 34
34 -
 35
35 -
 36
36 -
 37
37 -
 38
38 -
 39
39 -
 40
40 -
 41
41 -
 42
42 -
 43
43 -
 44
44 -
 45
45 -
 46
46 -
 47
47 -
 48
48 -
 49
49 -
 50
50 -
 51
51 -
 52
52 -
 53
53 -
 54
54 -
55
-
56
-
57
-
58
-
59
-
60
-
61
-
62
-
63
-
64
-
65
-
66
-
67
-
68
-
69
-
70
-
71
-
72
-
73
-
74
-
75
-
76
-
77
-
78
-
79
-
80
-
81
-
82
-
83
-
84
-
85
-
86
-
87
-
88
-
89
-
90
-
91
-
92
-
93
-
94
-
95
-
96
-
97
-
98
-
99
-
100
-
101
-
102
-
103
-
104
-
105
-
106
-
107
-
108
-
109
-
110
-
111
-
112
-
113
-
114
-
115
-
116
-
117
-
118
-
119
-
120
-
121
-
122
-
123
-
124
-
125
-
126
-
127
-
128
-
129
-
130
-
131
-
132
-
133
-
134
-
135
-
136
-
137
-
138
-
139
-
140
-
141
-
142
-
143
-
144
-
145
-
146
 |
 |

MANAGEMENT’S DISCUSSION AND ANALYSIS
WIRELESS
ROGERS IS CANADA’S LARGEST PROVIDER OF
WIRELESS COMMUNICATIONS SERVICES
As at December 31, 2015, we had:
• approximately 9.9 million subscribers; and
• approximately 34% subscriber share and 34% revenue share
of the Canadian wireless market.
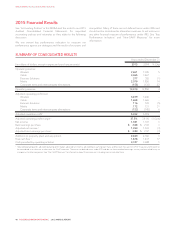
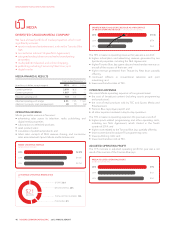
WIRELESS FINANCIAL RESULTS
Years ended December 31
(In millions of dollars, except margins) 2015 12014 % Chg
Operating revenue
Network revenue 6,902 6,743 2
Equipment sales 749 562 33
Operating revenue 7,651 7,305 5
Operating expenses
Cost of equipment 21,845 1,488 24
Other operating expenses 2,567 2,571 –
Operating expenses 4,412 4,059 9
Adjusted operating profit 3,239 3,246 –
Adjusted operating profit margin as a % of
network revenue 46.9% 48.1% (1.2 pts)
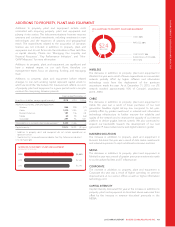
Additions to property, plant and equipment 866 978 (11)
1The operating results of Mobilicity are included in the Wireless results of operations
from the date of acquisition on July 2, 2015.
2Includes the cost of equipment sales and direct channel subsidies.
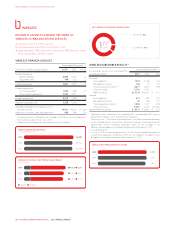
(IN MILLIONS OF DOLLARS)
WIRELESS NETWORK REVENUE
2015
2014
2013
$6,902
$6,743
$6,748
(IN THOUSANDS)
WIRELESS POSTPAID AND PREPAID SUBSCRIBERS
2015
2014
2013
1,606 8,271
1,377 8,073
1,429 8,074
PostpaidPrepaid
(%)
2015 WIRELESS OPERATING REVENUE MIX
NETWORK 90%
EQUIPMENT 10%
$7.7
BILLION
WIRELESS SUBSCRIBER RESULTS 1
(In thousands, except churn, postpaid ARPA,
and blended ARPU)
Years ended December 31
2015 2014 Chg
Postpaid
Gross additions 1,354 1,238 116
Net additions (losses) 106 (1) 107
Total postpaid subscribers 2,3 8,271 8,073 198
Churn (monthly) 1.27% 1.27% –
ARPA (monthly) $110.74 $106.41 $ 4.33
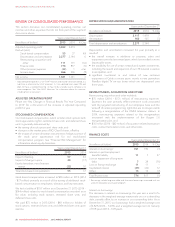
Prepaid
Gross additions 677 507 170
Net additions (losses) 75 (52) 127
Total prepaid subscribers 3,4 1,606 1,377 229
Churn (monthly) 3.45% 3.42% 0.03 pts
Blended ARPU (monthly) $ 59.71 $ 59.41 $ 0.30
1Subscriber counts, subscriber churn, postpaid ARPA, and blended ARPU are key
performance indicators. See “Key Performance Indicators”.
2Effective January 1, 2015 and on a prospective basis, our Wireless postpaid subscriber
results included Wireless Home Phone subscribers resulting in a base adjustment of
approximately 92,000 cumulative subscribers, which are not included in net
additions, but do appear in the ending total balance for December 31, 2015.
3As at end of period.
4On July 2, 2015, we acquired approximately 154,000 Wireless prepaid subscribers as
a result of our acquisition of Mobilicity, which are not included in net additions, but
do appear in the ending total balance for December 31, 2015.
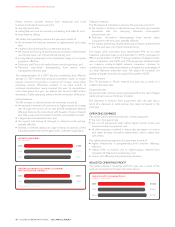
(%)
WIRELESS POSTPAID MONTHLY CHURN
2015
2014
2013
1.27%
1.27%
1.24%
42 ROGERS COMMUNICATIONS INC. 2015 ANNUAL REPORT