Rogers 2015 Annual Report Download - page 48
Download and view the complete annual report
Please find page 48 of the 2015 Rogers annual report below. You can navigate through the pages in the report by either clicking on the pages listed below, or by using the keyword search tool below to find specific information within the annual report.-
 1
1 -
2
-
3
-
4
-
5
-
6
-
7
-
8
-
9
-
10
-
11
-
12
-
13
-
14
-
15
-
16
-
17
-
18
-
19
-
20
-
21
-
22
-
23
-
24
-
25
-
26
-
27
-
28
-
29
-
30
-
31
-
32
-
33
-
34
-
35
-
36
-
37
-
 38
38 -
 39
39 -
 40
40 -
 41
41 -
 42
42 -
 43
43 -
 44
44 -
 45
45 -
 46
46 -
 47
47 -
 48
48 -
 49
49 -
 50
50 -
 51
51 -
 52
52 -
 53
53 -
 54
54 -
 55
55 -
 56
56 -
 57
57 -
 58
58 -
59
-
60
-
61
-
62
-
63
-
64
-
65
-
66
-
67
-
68
-
69
-
70
-
71
-
72
-
73
-
74
-
75
-
76
-
77
-
78
-
79
-
80
-
81
-
82
-
83
-
84
-
85
-
86
-
87
-
88
-
89
-
90
-
91
-
92
-
93
-
94
-
95
-
96
-
97
-
98
-
99
-
100
-
101
-
102
-
103
-
104
-
105
-
106
-
107
-
108
-
109
-
110
-
111
-
112
-
113
-
114
-
115
-
116
-
117
-
118
-
119
-
120
-
121
-
122
-
123
-
124
-
125
-
126
-
127
-
128
-
129
-
130
-
131
-
132
-
133
-
134
-
135
-
136
-
137
-
138
-
139
-
140
-
141
-
142
-
143
-
144
-
145
-
146
 |
 |

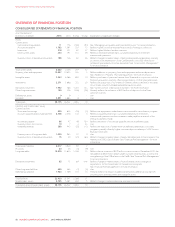
MANAGEMENT’S DISCUSSION AND ANALYSIS
Phone revenue includes revenue from residential and small
business local telephony service from:
• monthly service fees;
• calling features such as voicemail, call waiting, and caller ID; and
• long distance calling.
The stable total operating revenue this year was a result of:
• the movement of Internet customers to higher speed and usage
tiers;
• a higher subscriber base for our Internet products;
• the impact and timing of general pricing increases implemented
over the past year, net of promotional pricing; and
• an adjustment pertaining to the anticipated usage of our loyalty
programs; offset by
• Television and Phone subscriber losses over the past year; and
• Television subscribers downgrading their service plans
compared to the prior year.
The implementation of a CRTC decision mandating that, effective
January 23, 2015, telecommunications providers could no longer
require customers to provide a minimum of 30 days’ notice when
canceling services effectively resulted in an extra month of
customer deactivations being counted this year. As cancellations
occur throughout the year, we believe this caused a $24 million
decrease in Cable operating revenue for the remainder of the year.
Internet revenue
The 8% increase in Internet revenue this year was a result of:
• the general movement of customers to higher speed and usage
tiers through the launch of our new IGNITE broadband Internet
offerings that provide subscribers with broader choices of speed
and data usage and incorporate bundled, value-added content;
• a larger Internet subscriber base; and
• the impact and timing of changes in Internet service pricing;
partially offset by
• declines in Internet additional usage revenue as portions of the
subscriber base move to the higher-value, unlimited usage plans.
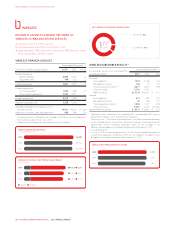
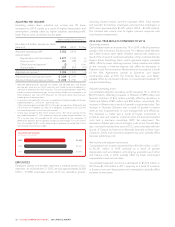
(IN THOUSANDS)
INTERNET SUBSCRIBERS
2015
2014
2013
2,048
2,011
1,961
No data available for the year 2013.
2015
2014
664%
700%
PERCENTAGE GROWTH IN INTERNET SUBSCRIBERS
WITH SERVICE OVER 100 Mbps
(%)
Television revenue
The 4% decrease in Television revenue this year was a result of:
• the decline in Television subscribers over the past year primarily
associated with the changing television consumption
environment; and
• Television subscribers downgrading their service plans
compared to the prior year; partially offset by
• the impact and timing of general pricing increases implemented
over the past year, net of promotional pricing.
The digital cable subscriber base represented 91% of our total
Television subscriber base as at December 31, 2015, compared to
88% as at December 31, 2014. The larger selection of digital content,
video-on-demand, and HDTV and PVR equipment combined with
our ongoing analog-to-digital network conversion continue to
contribute to the increasing penetration of digital as a percentage of
our total Television subscriber base. We expect to complete our
analog-to-digital conversion during the first quarter of 2016.
Phone revenue
The 7% decrease in Phone revenue this year was a result of a
smaller subscriber base.
Equipment sales
Equipment sales include revenue generated from the sale of digital
cable set-top boxes and Internet modems.
The decrease in revenue from equipment sales this year was a
result of a decrease in cable set-top box sales compared to the
prior year.
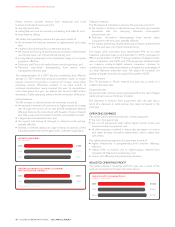
OPERATING EXPENSES
We assess Cable operating expenses in three categories:
• the cost of programming;
• the cost of equipment sales (cable digital set-top boxes and
Internet modem equipment); and
• all other expenses involved in day-to-day operations, to service
and retain existing subscriber relationships, and to attract new
subscribers.
The stable operating expenses this year were a result of:
• higher investments in programming and customer offerings;
offset by
• relative shifts in product mix to higher-margin Internet from
conventional Television broadcasting; and
• various cost efficiency and productivity initiatives.
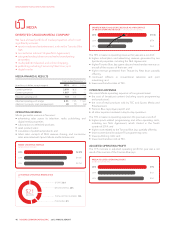
ADJUSTED OPERATING PROFIT
The stable adjusted operating profit this year was a result of the
revenue and expense changes described above.
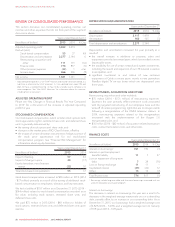
(IN MILLIONS OF DOLLARS)
CABLE ADJUSTED OPERATING PROFIT
2015
2014
2013
$1,658
$1,665
$1,718
46 ROGERS COMMUNICATIONS INC. 2015 ANNUAL REPORT