Rogers 2015 Annual Report Download - page 120
Download and view the complete annual report
Please find page 120 of the 2015 Rogers annual report below. You can navigate through the pages in the report by either clicking on the pages listed below, or by using the keyword search tool below to find specific information within the annual report.-
 1
1 -
2
-
3
-
4
-
5
-
6
-
7
-
8
-
9
-
10
-
11
-
12
-
13
-
14
-
15
-
16
-
17
-
18
-
19
-
20
-
21
-
22
-
23
-
24
-
25
-
26
-
27
-
28
-
29
-
30
-
31
-
32
-
33
-
34
-
35
-
36
-
37
-
38
-
39
-
40
-
41
-
42
-
43
-
44
-
45
-
46
-
47
-
48
-
49
-
50
-
51
-
52
-
53
-
54
-
55
-
56
-
57
-
58
-
59
-
60
-
61
-
62
-
63
-
64
-
65
-
66
-
67
-
68
-
69
-
70
-
71
-
72
-
73
-
74
-
75
-
76
-
77
-
78
-
79
-
80
-
81
-
82
-
83
-
84
-
85
-
86
-
87
-
88
-
89
-
90
-
91
-
92
-
93
-
94
-
95
-
96
-
97
-
98
-
99
-
100
-
101
-
102
-
103
-
104
-
105
-
106
-
107
-
108
-
109
-
 110
110 -
 111
111 -
 112
112 -
 113
113 -
 114
114 -
 115
115 -
 116
116 -
 117
117 -
 118
118 -
 119
119 -
 120
120 -
 121
121 -
 122
122 -
 123
123 -
 124
124 -
 125
125 -
 126
126 -
 127
127 -
 128
128 -
 129
129 -
 130
130 -
131
-
132
-
133
-
134
-
135
-
136
-
137
-
138
-
139
-
140
-
141
-
142
-
143
-
144
-
145
-
146
 |
 |

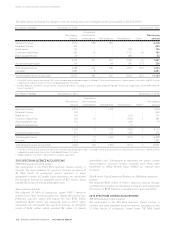
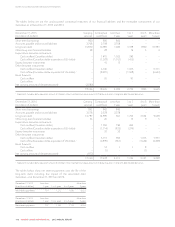
NOTES TO CONSOLIDATED FINANCIAL STATEMENTS
As at December 31, 2014
(In millions of dollars,
except exchange rates)
Notional
amount
(US$)
Exchange
rate
Notional
amount
(Cdn$)
Fair
value
(Cdn$)
Debt derivatives accounted for
as cash flow hedges:
As assets 5,725 1.0396 5,952 853
As liabilities 305 1.1857 362 (7)
Net mark-to-market asset
debt derivatives 846
Bond forwards accounted for
as cash flow hedges:
As assets – – 250 1
As liabilities – – 1,650 (14)
Net mark-to-market liability
bond forwards (13)
Expenditure derivatives
accounted for as cash flow
hedges:
As assets 960 1.0940 1,050 70
Equity derivatives not accounted
for as hedges:
As liabilities – – 286 (30)
Net mark-to-market asset 873
The table below shows derivative instruments assets and derivative
instruments liabilities reflected on our Consolidated Statements of
Financial Position.
As at December 31
(In millions of dollars) 2015 2014
Current asset 198 136
Long-term asset 1,992 788
2,190 924
Current liability (15) (40)
Long-term liability (95) (11)
(110) (51)
Net mark-to-market asset 2,080 873
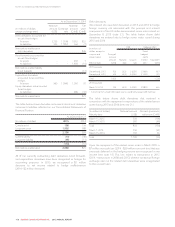
All of our currently outstanding debt derivatives, bond forwards,
and expenditure derivatives have been designated as hedges for
accounting purposes. In 2015, we recognized a $3 million
decrease to net income related to hedge ineffectiveness
(2014 – $2 million decrease).
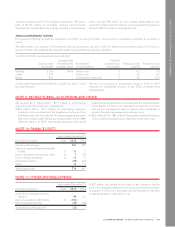
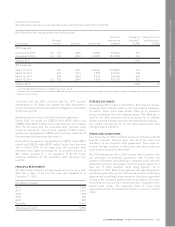
Debt derivatives
We entered into new debt derivatives in 2015 and 2014 to hedge
foreign currency risk associated with the principal and interest
components of the US dollar-denominated senior notes issued on
December 8, 2015 (note 21). The table below shows debt
derivatives we entered into to hedge senior notes issued during
2015 and 2014.
(In millions of
dollars, except for
coupon and
interest rates)
Effective date
US$ Hedging effect
Principal/
notional
amount
(US$)
Maturity
date
Coupon
rate
Fixed
hedged
Cdn$
interest
rate 1
Equivalent
Cdn$
2015 issuances
December 8, 2015 700 2025 3.625% 3.566% 937
December 8, 2015 300 2044 5.000% 5.145% 401
Total 1,000 1,338
2014 issuances
March 10, 2014 750 2044 5.000% 4.990% 832
1Converting from a fixed US$ coupon rate to a weighted average Cdn$ fixed rate.
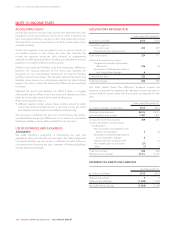
The table below shows debt derivatives that matured in
conjunction with the repayment or repurchase of the related senior
notes during 2015 and 2014 (see note 21).
(In millions of dollars)
Maturity date
Notional amount
(US$)
Net cash (proceeds)
settlement (Cdn$)
March 15, 2015 550 (106)
March 15, 2015 280 (48)
Total 830 (154)
March 1, 2014 750 (61)
March 15, 2014 350 26
Total 1,100 (35)
Upon the repayment of the related senior notes in March 2015, a
$7 million non-cash loss (2014 – $29 million non-cash loss) that was
previously deferred in the hedging reserve was recognized in net
income (see note 10). This loss relates to transactions in 2013
(2014 – transactions in 2008 and 2013) wherein contractual foreign
exchange rates on the related debt derivatives were renegotiated
to then-current rates.
118 ROGERS COMMUNICATIONS INC. 2015 ANNUAL REPORT