Rogers 2015 Annual Report Download - page 59
Download and view the complete annual report
Please find page 59 of the 2015 Rogers annual report below. You can navigate through the pages in the report by either clicking on the pages listed below, or by using the keyword search tool below to find specific information within the annual report.-
 1
1 -
2
-
3
-
4
-
5
-
6
-
7
-
8
-
9
-
10
-
11
-
12
-
13
-
14
-
15
-
16
-
17
-
18
-
19
-
20
-
21
-
22
-
23
-
24
-
25
-
26
-
27
-
28
-
29
-
30
-
31
-
32
-
33
-
34
-
35
-
36
-
37
-
38
-
39
-
40
-
41
-
42
-
43
-
44
-
45
-
46
-
47
-
48
-
 49
49 -
 50
50 -
 51
51 -
 52
52 -
 53
53 -
 54
54 -
 55
55 -
 56
56 -
 57
57 -
 58
58 -
 59
59 -
 60
60 -
 61
61 -
 62
62 -
 63
63 -
 64
64 -
 65
65 -
 66
66 -
 67
67 -
 68
68 -
 69
69 -
70
-
71
-
72
-
73
-
74
-
75
-
76
-
77
-
78
-
79
-
80
-
81
-
82
-
83
-
84
-
85
-
86
-
87
-
88
-
89
-
90
-
91
-
92
-
93
-
94
-
95
-
96
-
97
-
98
-
99
-
100
-
101
-
102
-
103
-
104
-
105
-
106
-
107
-
108
-
109
-
110
-
111
-
112
-
113
-
114
-
115
-
116
-
117
-
118
-
119
-
120
-
121
-
122
-
123
-
124
-
125
-
126
-
127
-
128
-
129
-
130
-
131
-
132
-
133
-
134
-
135
-
136
-
137
-
138
-
139
-
140
-
141
-
142
-
143
-
144
-
145
-
146
 |
 |

MANAGEMENT’S DISCUSSION AND ANALYSIS
Managing Our Liquidity and Financial Resources
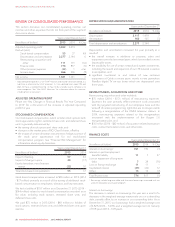
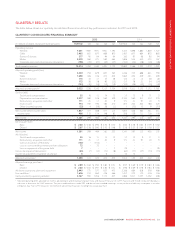
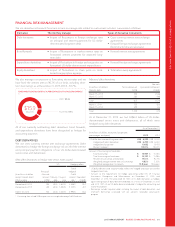
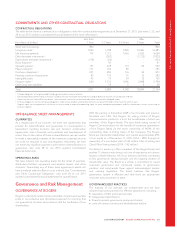
SOURCES AND USES OF CASH
OPERATING, INVESTING AND FINANCING ACTIVITIES
Years ended December 31
(In millions of dollars) 2015 2014
Cash provided by operating activities before changes in non-cash working capital, income taxes paid, and
interest paid 5,004 4,925
Change in non-cash operating working capital items (302) 11
Cash provided by operating activities before income taxes paid and interest paid 4,702 4,936
Income taxes paid (184) (460)
Interest paid (771) (778)
Cash provided by operating activities 3,747 3,698
Investing activities:
Additions to property, plant and equipment (2,440) (2,366)
Additions to program rights (64) (231)
Changes in non-cash working capital related to property, plant and equipment and intangible assets (116) 153
Acquisitions and other strategic transactions, net of cash acquired (1,077) (3,456)
Other (70) (51)
Cash used in investing activities (3,767) (5,951)
Financing activities:
Proceeds received on short-term borrowings 294 276
Repayment of short-term borrowings (336) (84)
Issuance of long-term debt 7,338 3,412
Repayment of long-term debt (6,584) (2,551)
Proceeds on settlement of debt derivatives and forward contracts 1,059 2,150
Payments on settlement of debt derivatives, forward contracts, and bond forwards (930) (2,115)
Transaction costs incurred (9) (30)
Dividends paid (977) (930)
Cash (used in) provided by financing activities (145) 128
Change in cash and cash equivalents (165) (2,125)
Cash and cash equivalents, beginning of year 176 2,301
Cash and cash equivalents, end of year 11 176
OPERATING ACTIVITIES
The 1% increase in cash provided by operating activities this year
was a result of lower cash income tax payments resulting from the
acquisition of Mobilicity, partially offset by higher net investment in
non-cash working capital.
INVESTING ACTIVITIES
Additions to property, plant and equipment
We spent $2,440 million this year on property, plant and
equipment additions before changes in non-cash working capital
items, which was 3% higher than 2014. See “Additions to Property,
Plant and Equipment” for more information.
Acquisitions and other strategic transactions
We made total payments of $129 million this year related to the
acquisition of 2500 MHz spectrum licences and Shaw spectrum
licences (including $2 million of related transaction costs) and $948
million related to the acquisitions of Mobilicity, our investment in
Glentel, certain dealer stores, and IAI. Expenditures in 2014 were
for the acquisition of our 700 MHz spectrum and our acquisition of
Source Cable.
Additions to program rights
This year, we spent $64 million on additions to program rights. We
spent $231 million last year on additions to program rights
primarily as a result of the NHL Agreement.
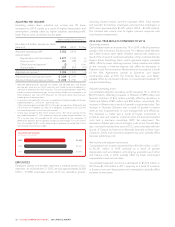
FINANCING ACTIVITIES
Accounts receivable securitization
The $294 million (2014 – $276 million) of funding we received this
year under our accounts receivable securitization program and the
related $336 million (2014 – $84 million) of repayments we made
changed our total funding under the program to $800 million as at
December 31, 2015 (2014 – $842 million). As at December 31,
2015, the program was committed to fund up to a maximum of
$1,050 million (2014 – $900 million). Effective January 2015, we
amended the terms of the program, increasing the maximum
potential proceeds under the program to $1.05 billion and
extending the term to January 1, 2018.
We continue to service and retain substantially all of the risks and
rewards relating to the accounts receivables we sell, and therefore,
the receivables remain recognized on our consolidated statements
of financial position and the funding received is recorded as short-
2015 ANNUAL REPORT ROGERS COMMUNICATIONS INC. 57