Rogers 2015 Annual Report Download - page 55
Download and view the complete annual report
Please find page 55 of the 2015 Rogers annual report below. You can navigate through the pages in the report by either clicking on the pages listed below, or by using the keyword search tool below to find specific information within the annual report.-
 1
1 -
2
-
3
-
4
-
5
-
6
-
7
-
8
-
9
-
10
-
11
-
12
-
13
-
14
-
15
-
16
-
17
-
18
-
19
-
20
-
21
-
22
-
23
-
24
-
25
-
26
-
27
-
28
-
29
-
30
-
31
-
32
-
33
-
34
-
35
-
36
-
37
-
38
-
39
-
40
-
41
-
42
-
43
-
44
-
 45
45 -
 46
46 -
 47
47 -
 48
48 -
 49
49 -
 50
50 -
 51
51 -
 52
52 -
 53
53 -
 54
54 -
 55
55 -
 56
56 -
 57
57 -
 58
58 -
 59
59 -
 60
60 -
 61
61 -
 62
62 -
 63
63 -
 64
64 -
 65
65 -
66
-
67
-
68
-
69
-
70
-
71
-
72
-
73
-
74
-
75
-
76
-
77
-
78
-
79
-
80
-
81
-
82
-
83
-
84
-
85
-
86
-
87
-
88
-
89
-
90
-
91
-
92
-
93
-
94
-
95
-
96
-
97
-
98
-
99
-
100
-
101
-
102
-
103
-
104
-
105
-
106
-
107
-
108
-
109
-
110
-
111
-
112
-
113
-
114
-
115
-
116
-
117
-
118
-
119
-
120
-
121
-
122
-
123
-
124
-
125
-
126
-
127
-
128
-
129
-
130
-
131
-
132
-
133
-
134
-
135
-
136
-
137
-
138
-
139
-
140
-
141
-
142
-
143
-
144
-
145
-
146
 |
 |

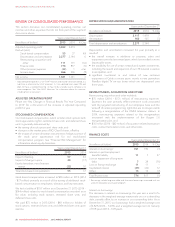
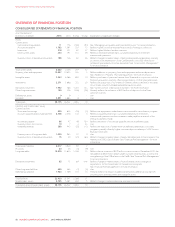
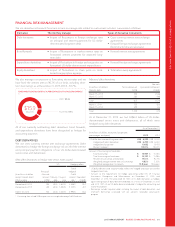
MANAGEMENT’S DISCUSSION AND ANALYSIS
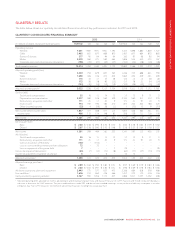
QUARTERLY RESULTS
The table below shows our quarterly consolidated financial results and key performance indicators for 2015 and 2014.
QUARTERLY CONSOLIDATED FINANCIAL SUMMARY
2015 2014
(In millions of dollars, except per share amounts) Full Year Q4 Q3 Q2 Q1 Full Year Q4 Q3 Q2 Q1
Operating revenue
Wireless 7,651 1,981 1,973 1,903 1,794 7,305 1,898 1,880 1,800 1,727
Cable 3,465 855 871 869 870 3,467 871 864 872 860
Business Solutions 377 95 94 94 94 382 97 96 95 94
Media 2,079 560 473 582 464 1,826 544 440 475 367
Corporate items and intercompany eliminations (158) (39) (27) (45) (47) (130) (44) (28) (30) (28)
Total operating revenue 13,414 3,452 3,384 3,403 3,175 12,850 3,366 3,252 3,212 3,020
Adjusted operating profit (loss)
Wireless 3,239 754 879 841 765 3,246 725 888 843 790
Cable 1,658 426 416 414 402 1,665 424 409 423 409
Business Solutions 116 30 31 27 28 122 34 32 28 28
Media 172 56 58 90 (32) 131 78 23 54 (24)
Corporate items and intercompany eliminations (153) (40) (39) (35) (39) (145) (28) (40) (35) (42)
Adjusted operating profit 15,032 1,226 1,345 1,337 1,124 5,019 1,233 1,312 1,313 1,161
Deduct (add):
Stock-based compensation 55 16 13 14 12 37 12 9 11 5
Depreciation and amortization 2,277 580 576 562 559 2,144 560 533 532 519
Restructuring, acquisition and other 111 23 37 42 9 173 43 91 30 9
Finance costs 774 192 190 182 210 817 202 202 188 225
Other (income) expense (32) 4 (59) 26 (3) 1 (10) 12 9 (10)
Net income before income taxes 1,847 411 588 511 337 1,847 426 465 543 413
Income taxes 466 112 124 148 82 506 129 133 138 106
Net income 1,381 299 464 363 255 1,341 297 332 405 307
Earnings per share:
Basic $2.68$ 0.58 $ 0.90 $ 0.70 $ 0.50 $ 2.60 $ 0.58 $ 0.64 $ 0.79 $ 0.60
Diluted $2.67$ 0.58 $ 0.90 $ 0.70 $ 0.48 $ 2.56 $ 0.57 $ 0.64 $ 0.76 $ 0.57
Net income 1,381 299 464 363 255 1,341 297 332 405 307
Add (deduct):
Stock-based compensation 55 16 13 14 12 37 12 9 11 5
Restructuring, acquisition and other 111 23 37 42 9 173 43 91 30 9
Gain on acquisition of Mobilicity (102) – (102) – – –––––
Loss on non-controlling interest purchase obligation 72 –72–– –––––
Loss on repayment of long-term debt 7–––7 29–––29
Income tax impact of above items (40) (7) (12) (13) (8) (62) (11) (27) (14) (10)
Income tax adjustment, legislative tax change 6––6– 1414–––
Adjusted net income 11,490 331 472 412 275 1,532 355 405 432 340
Adjusted earnings per share 1:
Basic $2.89$ 0.64 $ 0.92 $ 0.80 $ 0.53 $ 2.97 $ 0.69 $ 0.79 $ 0.84 $ 0.66
Diluted $2.88$ 0.64 $ 0.91 $ 0.80 $ 0.53 $ 2.96 $ 0.69 $ 0.78 $ 0.84 $ 0.66
Additions to property, plant and equipment 2,440 773 571 621 475 2,366 664 638 576 488
Free cash flow 11,676 274 660 476 266 1,437 275 370 436 356
Cash provided by operating activities 3,747 950 1,456 1,114 227 3,698 1,031 1,057 1,202 408
1Adjusted operating profit, adjusted net income, adjusted basic and diluted earnings per share, and free cash flow are non-GAAP measures and should notbeconsideredasa
substitute or alternative for GAAP measures. They are not defined terms under IFRS, and do not have standard meanings, so may not be a reliable way to compare us to other
companies. See “Non-GAAP Measures” for information about these measures, including how we calculate them.
2015 ANNUAL REPORT ROGERS COMMUNICATIONS INC. 53