Rogers 2015 Annual Report Download - page 61
Download and view the complete annual report
Please find page 61 of the 2015 Rogers annual report below. You can navigate through the pages in the report by either clicking on the pages listed below, or by using the keyword search tool below to find specific information within the annual report.-
 1
1 -
2
-
3
-
4
-
5
-
6
-
7
-
8
-
9
-
10
-
11
-
12
-
13
-
14
-
15
-
16
-
17
-
18
-
19
-
20
-
21
-
22
-
23
-
24
-
25
-
26
-
27
-
28
-
29
-
30
-
31
-
32
-
33
-
34
-
35
-
36
-
37
-
38
-
39
-
40
-
41
-
42
-
43
-
44
-
45
-
46
-
47
-
48
-
49
-
50
-
 51
51 -
 52
52 -
 53
53 -
 54
54 -
 55
55 -
 56
56 -
 57
57 -
 58
58 -
 59
59 -
 60
60 -
 61
61 -
 62
62 -
 63
63 -
 64
64 -
 65
65 -
 66
66 -
 67
67 -
 68
68 -
 69
69 -
 70
70 -
 71
71 -
72
-
73
-
74
-
75
-
76
-
77
-
78
-
79
-
80
-
81
-
82
-
83
-
84
-
85
-
86
-
87
-
88
-
89
-
90
-
91
-
92
-
93
-
94
-
95
-
96
-
97
-
98
-
99
-
100
-
101
-
102
-
103
-
104
-
105
-
106
-
107
-
108
-
109
-
110
-
111
-
112
-
113
-
114
-
115
-
116
-
117
-
118
-
119
-
120
-
121
-
122
-
123
-
124
-
125
-
126
-
127
-
128
-
129
-
130
-
131
-
132
-
133
-
134
-
135
-
136
-
137
-
138
-
139
-
140
-
141
-
142
-
143
-
144
-
145
-
146
 |
 |

MANAGEMENT’S DISCUSSION AND ANALYSIS
In 2014, we repaid or repurchased our US$750 million
($834 million) and US$350 million ($387 million) senior notes that
were due in March 2014. At the same time, the associated debt
derivatives were settled at maturity for net proceeds received of
$35 million, resulting in a net repayment of $1,186 million
including settlement of the associated debt derivatives.
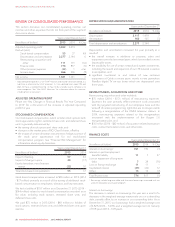
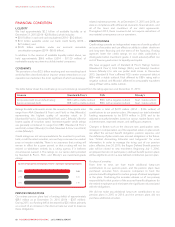
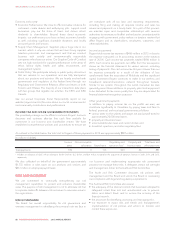
Weighted average cost of borrowings
Our borrowings had a weighted average cost of 4.82% as at
December 31, 2015 (2014 – 5.20%) and a weighted average term
to maturity of 10.8 years (2014 – 10.8 years). This comparatively
favourable decline in our 2015 weighted average interest rate
reflects the combined effects of:
• greater utilization of our bank credit facilities;
• our issuance of senior notes in December 2015 at comparatively
lower interest rates; and
• the scheduled repayments and repurchases of comparatively
more expensive senior notes made in March 2014 and March
2015.
(%)
WEIGHTED AVERAGE COST OF BORROWINGS
2015
2014
2013
4.82%
5.20%
5.54%
RATIO OF ADJUSTED NET DEBT / ADJUSTED OPERATING PROFIT
2015
2014
2013
3.1x
2.9x
2.3x
Dividends
In 2015, we declared and paid dividends on each of our
outstanding Class A Voting and Class B Non-Voting shares. We
paid $977 million in cash dividends, an increase of $47 million from
2014. See “Dividends and Share Information” for more information.
Shelf prospectuses
We have two shelf prospectuses that qualify the offering of debt
securities from time to time. One shelf prospectus qualifies the
public offering of up to $4 billion of our debt securities in each of
the provinces of Canada (Canadian Shelf) and the other shelf
prospectus (together with a corresponding registration statement
filed with the US Securities and Exchange Commission) qualifies
the public offering of up to US$4 billion of our debt securities in
the United States and Ontario (US Shelf). Both the Canadian Shelf
and the US Shelf expire in March 2016. In March 2014, we issued
$1.25 billion of debt securities under the Canadian Shelf and
US$750 million ($832 million) of debt securities under the US Shelf.
In December 2015, we issued US$1,000 million ($1,338 million) of
debt securities under the US Shelf. See “Issuance of senior notes
and related debt derivatives” for more information.
Dissolution of RCP
On January 1, 2016, Fido Solutions Inc., a subsidiary of RCI,
transferred its partnership interest in RCP to Rogers Cable and Data
Centres Inc. (RCDCI), a subsidiary of RCI, leaving RCDCI as the sole
partner of RCP, thereby causing RCP to cease to exist. RCDCI
became the owner of all the assets and assumed all the liabilities
previously held by RCP. Subsequent to the reorganization, RCDCI
changed its name to Rogers Communications Canada Inc. (RCCI).
Effective January 1, 2016, as a result of the dissolution, RCP is no
longer a guarantor, or co-obligor, as applicable, for the Company’s
bank credit and letter of credit facilities, senior notes and
debentures, and derivative instruments. RCI continues to be the
obligor in respect of each of these, while RCCI remains either a co-
obligor or guarantor for the senior notes and debentures and a
guarantor, as applicable, for the bank credit and letter of credit
facilities and derivative instruments.
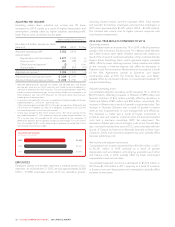
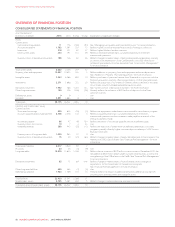
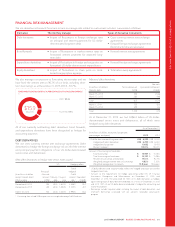
FREE CASH FLOW
Years ended December 31
(In millions of dollars) 2015 2014 % Chg
Adjusted operating profit 15,032 5,019 –
Deduct (add):
Additions to property, plant and
equipment 22,440 2,366 3
Interest on borrowings, net of
capitalized interest 732 756 (3)
Cash income taxes 3184 460 (60)
Free cash flow 11,676 1,437 17
1Adjusted operating profit and free cash flow are non-GAAP measures and should not
be considered as a substitute or alternative for GAAP measures. They are not defined
terms under IFRS, and do not have standard meanings, so may not be a reliable way
to compare us to other companies. See “Non-GAAP Measures” for information about
these measures, including how we calculate them.
2Additions to property, plant and equipment do not include expenditures for
spectrum licences.
3Cash income taxes are net of refunds received.
The 17% increase in free cash flow this year was mainly a result of:
• lower cash income tax payments resulting from the acquisition of
Mobilicity; partially offset by
• higher additions to property, plant and equipment.
(IN MILLIONS OF DOLLARS)
FREE CASH FLOW
2015
2014
2013
$1,676
$1,437
$1,548
2015 ANNUAL REPORT ROGERS COMMUNICATIONS INC. 59