Rogers 2015 Annual Report Download - page 123
Download and view the complete annual report
Please find page 123 of the 2015 Rogers annual report below. You can navigate through the pages in the report by either clicking on the pages listed below, or by using the keyword search tool below to find specific information within the annual report.-
 1
1 -
2
-
3
-
4
-
5
-
6
-
7
-
8
-
9
-
10
-
11
-
12
-
13
-
14
-
15
-
16
-
17
-
18
-
19
-
20
-
21
-
22
-
23
-
24
-
25
-
26
-
27
-
28
-
29
-
30
-
31
-
32
-
33
-
34
-
35
-
36
-
37
-
38
-
39
-
40
-
41
-
42
-
43
-
44
-
45
-
46
-
47
-
48
-
49
-
50
-
51
-
52
-
53
-
54
-
55
-
56
-
57
-
58
-
59
-
60
-
61
-
62
-
63
-
64
-
65
-
66
-
67
-
68
-
69
-
70
-
71
-
72
-
73
-
74
-
75
-
76
-
77
-
78
-
79
-
80
-
81
-
82
-
83
-
84
-
85
-
86
-
87
-
88
-
89
-
90
-
91
-
92
-
93
-
94
-
95
-
96
-
97
-
98
-
99
-
100
-
101
-
102
-
103
-
104
-
105
-
106
-
107
-
108
-
109
-
110
-
111
-
112
-
 113
113 -
 114
114 -
 115
115 -
 116
116 -
 117
117 -
 118
118 -
 119
119 -
 120
120 -
 121
121 -
 122
122 -
 123
123 -
 124
124 -
 125
125 -
 126
126 -
 127
127 -
 128
128 -
 129
129 -
 130
130 -
 131
131 -
 132
132 -
 133
133 -
134
-
135
-
136
-
137
-
138
-
139
-
140
-
141
-
142
-
143
-
144
-
145
-
146
 |
 |

NOTES TO CONSOLIDATED FINANCIAL STATEMENTS
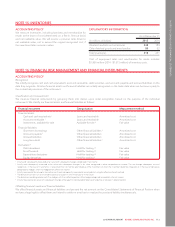
NOTE 17: INVESTMENTS
ACCOUNTING POLICY
Investments in publicly traded and private companies
We classify our investments in publicly traded and private
companies where we have no control or significant influence as
available-for-sale investments and account for them as follows:
• publicly traded companies – at fair value based on publicly
quoted prices; and
• private companies – at fair value using implied valuations from
follow-on financing rounds, third party sale negotiations, or
market-based approaches.
Investments in associates and joint arrangements
An entity is an associate when we have significant influence over the
entity’s financial and operating policies but do not control it. We
are generally presumed to have significant influence over an entity
when we hold more than 20% of the voting power.
A joint arrangement exists when there is a contractual agreement
that establishes joint control over activities and requires unanimous
consent for strategic financial and operating decisions. We classify
our interests in joint arrangements into one of two categories:
• joint ventures – when we have the rights to the net assets of the
arrangement; and
• joint operations – when we have the rights to the assets and
obligations for the liabilities related to the arrangement.
We use the equity method to account for our investments in
associates and joint ventures; we recognize our proportionate
interest in the assets, liabilities, revenue, and expenses of our joint
operations.
We recognize our investments in associates and joint ventures
initially at cost and then increase or decrease the carrying amounts
based on our share of each entity’s income or loss after initial
recognition. Distributions we receive from these entities reduce the
carrying amounts of our investments.
We eliminate unrealized gains and losses from our investments in
associates or joint ventures against our investments, up to the
amount of our interest in the entities.
Impairment in associates and joint ventures
At the end of each reporting period, we assess whether there is
objective evidence that impairment exists in our investments in
associates and joint ventures. If objective evidence exists, we
compare the carrying amount of the investment to its recoverable
amount and recognize the excess over the recoverable amount, if
any, as a loss in net income.
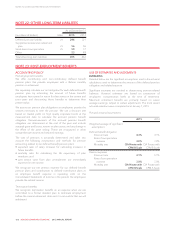
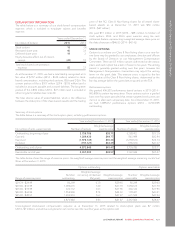
EXPLANATORY INFORMATION
As at December 31
(In millions of dollars) 2015 2014
Investments in:
Publicly traded companies 966 1,130
Private companies 212 161
Investments, available-for-sale 1,178 1,291
Investments, associates and joint ventures 1,093 607
Total investments 2,271 1,898
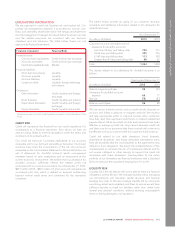
INVESTMENTS, AVAILABLE-FOR-SALE
Publicly traded companies
We hold interests in a number of publicly traded companies. This
yearwerecognizedrealizedlossesofnilandunrealizedlossesof
$164 million (2014 – $3 million of realized gains and $325 million
of unrealized gains) with a corresponding decrease in net income
and other comprehensive income, respectively.
INVESTMENTS, ASSOCIATES, AND JOINT VENTURES
We have interests in a number of associates and joint ventures,
some of which include:
Maple Leaf Sports and Entertainment Limited (MLSE)
MLSE, a sports and entertainment company, owns and operates
the Air Canada Centre, the NHL’s Toronto Maple Leafs, the NBA’s
Toronto Raptors, MLS’ Toronto FC, the AHL’s Toronto Marlies, and
other assets. We, along with BCE Inc. (BCE), jointly own an indirect
net 75% equity interest in MLSE with our portion representing a
37.5% equity interest in MLSE. Our investment in MLSE is
accounted for as a joint venture using the equity method.
shomi
In 2014, we entered into a joint venture equally owned by Rogers
and Shaw to develop, launch, and operate a premium subscription
video-on-demand service offering movies and television series for
viewing online and through cable set-top boxes. Our investment in
shomi is accounted for as a joint venture using the equity method.
Glentel
In 2015, we completed our purchase of 50% of the common
shares of Glentel Inc. (Glentel) from BCE for cash consideration of
$473 million such that Glentel is jointly owned by us and BCE.
Glentel is a large, multicarrier mobile phone retailer with several
hundred Canadian wireless retail distribution outlets, as well as
operations in the US and Australia. Our investment in Glentel is
accounted for as a joint venture using the equity method.
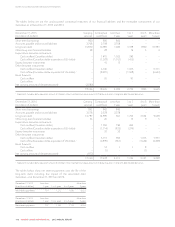
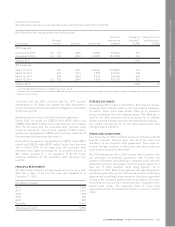
The following table provides summary financial information on all
our associates and joint ventures and our portions thereof. We
recognize our investments in joint ventures and associates using
the equity method.
As at or years ended December 31
(In millions of dollars) 2015 2014
Current assets 1,024 261
Long-term assets 3,295 2,577
Current liabilities (935) (432)
Long-term liabilities (1,221) (1,247)
Total net assets 2,163 1,159
Our share of net assets 1,086 580
Revenue 1,958 714
Expenses (2,178) (736)
Total net loss (220) (22)
Our share of net loss (99) (11)
2015 ANNUAL REPORT ROGERS COMMUNICATIONS INC. 121