Rogers 2015 Annual Report Download - page 45
Download and view the complete annual report
Please find page 45 of the 2015 Rogers annual report below. You can navigate through the pages in the report by either clicking on the pages listed below, or by using the keyword search tool below to find specific information within the annual report.-
 1
1 -
2
-
3
-
4
-
5
-
6
-
7
-
8
-
9
-
10
-
11
-
12
-
13
-
14
-
15
-
16
-
17
-
18
-
19
-
20
-
21
-
22
-
23
-
24
-
25
-
26
-
27
-
28
-
29
-
30
-
31
-
32
-
33
-
34
-
 35
35 -
 36
36 -
 37
37 -
 38
38 -
 39
39 -
 40
40 -
 41
41 -
 42
42 -
 43
43 -
 44
44 -
 45
45 -
 46
46 -
 47
47 -
 48
48 -
 49
49 -
 50
50 -
 51
51 -
 52
52 -
 53
53 -
 54
54 -
 55
55 -
56
-
57
-
58
-
59
-
60
-
61
-
62
-
63
-
64
-
65
-
66
-
67
-
68
-
69
-
70
-
71
-
72
-
73
-
74
-
75
-
76
-
77
-
78
-
79
-
80
-
81
-
82
-
83
-
84
-
85
-
86
-
87
-
88
-
89
-
90
-
91
-
92
-
93
-
94
-
95
-
96
-
97
-
98
-
99
-
100
-
101
-
102
-
103
-
104
-
105
-
106
-
107
-
108
-
109
-
110
-
111
-
112
-
113
-
114
-
115
-
116
-
117
-
118
-
119
-
120
-
121
-
122
-
123
-
124
-
125
-
126
-
127
-
128
-
129
-
130
-
131
-
132
-
133
-
134
-
135
-
136
-
137
-
138
-
139
-
140
-
141
-
142
-
143
-
144
-
145
-
146
 |
 |

MANAGEMENT’S DISCUSSION AND ANALYSIS
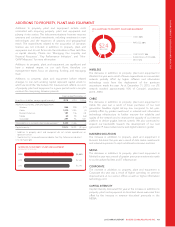
OPERATING REVENUE
Our operating revenue depends on the size of our subscriber base,
the revenue per account, the revenue from the sale of wireless
devices, and other equipment sales.
Network revenue
Network revenue includes revenue derived from voice and data
services from:
• postpaid and prepaid monthly fees;
•datausage;
•airtime;
•longdistancecharges;
• essential services charges;
• inbound and outbound roaming charges; and
• certain fees.
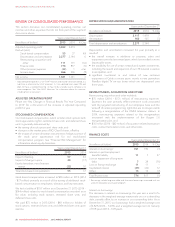
The 2% increase in network revenue this year was a result of:
• the continued adoption of customer-friendly Rogers Share
Everything plans, which generate higher postpaid ARPA, bundle
in various calling features and long distance, provide the ability
to pool data usage across multiple devices, and grant access to
our other offerings, such as Roam Like Home, Rogers NHL
GameCentre LIVE, Spotify Premium, shomi, and Texture by Next
Issue;
• our acquisition of Mobilicity; and
• an adjustment pertaining to the anticipated usage of our loyalty
programs; partially offset by
• a 13% decrease in roaming revenue this year as a result of
changes to roaming plans, including the introduction of Roam
Like Home in the US, Caribbean, Mexico, Latin America, and
Europe, which simplify the customer experience and provide
greater value to the customer.
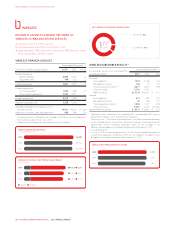
The 4% increase in postpaid ARPA was a result of the continued
adoption of Rogers Share Everything plans relative to the number
of subscriber accounts as customers increasingly utilize the
advantages of premium offerings and access their shareable plans
with multiple devices on the same account.
($)
No data available for the year 2013.
POSTPAID ARPA
2015
2014
$110.74
$106.41
SHARE EVERYTHING SUBSCRIBERS AS A PERCENTAGE OF OUR
ROGERS-BRANDED POSTPAID SUBSCRIBER BASE (%)
2015
2014
2013
51%
31%
7%
The 1% increase in blended ARPU this year was a result of:
• increased network revenue as discussed above; partially offset by
• the impact of expanding our lower-blended-ARPU-generating
prepaid subscriber base relative to our total subscriber base as a
result of our acquisition of Mobilicity and the general increase in
prepaid net additions; and
• the inclusion of lower-blended-ARPU-generating Wireless Home
Phone subscribers in our postpaid base.
Excluding the impact of roaming revenue and the addition of
Mobilicity and Wireless Home Phone subscribers, blended ARPU
would have increased by 4% this year.
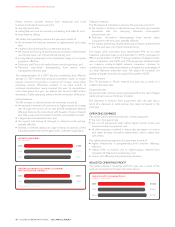
We believe the increases in gross and net additions to our postpaid
subscriber base and stable postpaid churn this year were results of
our strategic focus on enhancing the customer experience by
providing higher-value offerings, such as our new Share Everything
plans, and improving our customer service. Significantly, this was
achieved during the industry’s “double cohort” period and with
heightened competitive activity.
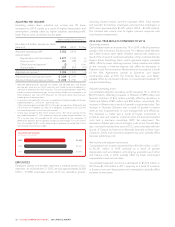
(IN THOUSANDS)
Not applicable for 2013.
ROAM LIKE HOME SUBSCRIBERS
2015
2014
2,252
457
The “double cohort” refers to the greater-than-usual number of
subscriber contracts that ended as both three-year and two-year
contracts expired near the same time. This industry-wide impact
commenced late in the second quarter of 2015 and will generally
result in subscribers being on shorter-term contracts than in the
past.
We activated and upgraded approximately 3.0 million
smartphones for new and existing subscribers this year, compared
to approximately 2.6 million in 2014. The increase was due to an
11% increase in hardware upgrades and a 9% increase in gross
additions.
The increase in our prepaid subscriber base was primarily a result of
the acquisition of approximately 154,000 subscribers upon our
acquisition of Mobilicity and an increase in net additions of 75,000
subscribers mainly due to our chatr national expansion initiative.
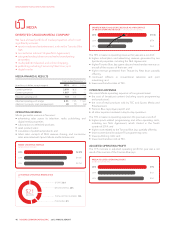
Equipment sales
Equipment sales (net of subsidies) include revenue from sales to:
• independent dealers, agents, and retailers; and
• subscribers through fulfillment by Wireless’ customer service
groups, websites, telesales, and corporate stores.
The 33% increase in revenue from equipment sales this year, in part
due to the impact of the industry’s double cohort, was a result of:
• 11% more device upgrades by existing subscribers; and
• increases in equipment sales prices.
2015 ANNUAL REPORT ROGERS COMMUNICATIONS INC. 43