Rogers 2015 Annual Report Download - page 107
Download and view the complete annual report
Please find page 107 of the 2015 Rogers annual report below. You can navigate through the pages in the report by either clicking on the pages listed below, or by using the keyword search tool below to find specific information within the annual report.-
 1
1 -
2
-
3
-
4
-
5
-
6
-
7
-
8
-
9
-
10
-
11
-
12
-
13
-
14
-
15
-
16
-
17
-
18
-
19
-
20
-
21
-
22
-
23
-
24
-
25
-
26
-
27
-
28
-
29
-
30
-
31
-
32
-
33
-
34
-
35
-
36
-
37
-
38
-
39
-
40
-
41
-
42
-
43
-
44
-
45
-
46
-
47
-
48
-
49
-
50
-
51
-
52
-
53
-
54
-
55
-
56
-
57
-
58
-
59
-
60
-
61
-
62
-
63
-
64
-
65
-
66
-
67
-
68
-
69
-
70
-
71
-
72
-
73
-
74
-
75
-
76
-
77
-
78
-
79
-
80
-
81
-
82
-
83
-
84
-
85
-
86
-
87
-
88
-
89
-
90
-
91
-
92
-
93
-
94
-
95
-
96
-
 97
97 -
 98
98 -
 99
99 -
 100
100 -
 101
101 -
 102
102 -
 103
103 -
 104
104 -
 105
105 -
 106
106 -
 107
107 -
 108
108 -
 109
109 -
 110
110 -
 111
111 -
 112
112 -
 113
113 -
 114
114 -
 115
115 -
 116
116 -
 117
117 -
118
-
119
-
120
-
121
-
122
-
123
-
124
-
125
-
126
-
127
-
128
-
129
-
130
-
131
-
132
-
133
-
134
-
135
-
136
-
137
-
138
-
139
-
140
-
141
-
142
-
143
-
144
-
145
-
146
 |
 |

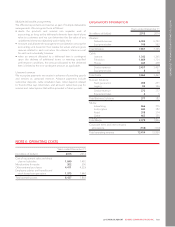
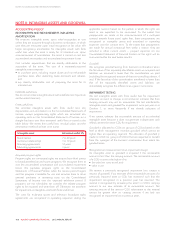
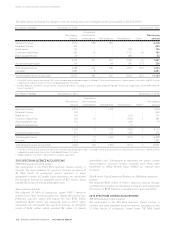
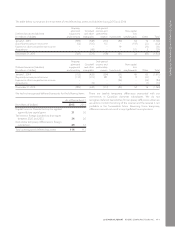
NOTES TO CONSOLIDATED FINANCIAL STATEMENTS
EXPLANATORY INFORMATION
(In millions of dollars) December 31, 2015 December 31, 2014 December 31, 2013
Cost
Accumulated
depreciation
Net
carrying
amount Cost
Accumulated
depreciation
Net
carrying
amount Cost
Accumulated
depreciation
Net
carrying
amount
Land and buildings 998 (347) 651 942 (319) 623 923 (291) 632
Cable and wireless networks 20,900 (13,579) 7,321 19,588 (12,387) 7,201 18,197 (11,287) 6,910
Computer equipment and software 5,294 (3,421) 1,873 4,960 (3,353) 1,607 4,553 (3,031) 1,522
Customer premise equipment 1,658 (1,197) 461 1,543 (988) 555 2,009 (1,415) 594
Leasehold improvements 423 (175) 248 383 (151) 232 492 (271) 221
Equipment and vehicles 1,311 (868) 443 1,236 (799) 437 1,124 (748) 376
Total property, plant and equipment 30,584 (19,587) 10,997 28,652 (17,997) 10,655 27,298 (17,043) 10,255
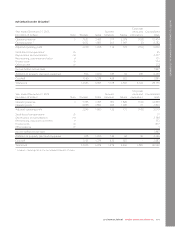
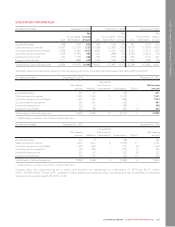
The tables below summarize the changes in the net carrying amounts of property, plant and equipment during 2015 and 2014.
(In millions of dollars) December 31, 2014 December 31, 2015
Net carrying
amount Additions
Acquisitions
from business
combinations Depreciation Other 1
Net carrying
amount
Land and buildings 623 57 – (29) – 651
Cable and wireless networks 7,201 1,322 15 (1,217) – 7,321
Computer equipment and software 1,607 691 1 (426) – 1,873
Customer premise equipment 555 245 – (339) – 461
Leasehold improvements 232 37 1 (25) 3 248
Equipment and vehicles 437 88 – (81) (1) 443
Total property, plant and equipment 10,655 2,440 17 (2,117) 2 10,997
1Includes disposals, write-downs, reclassifications, and other adjustments.
(In millions of dollars) December 31, 2013 December 31, 2014
Net carrying
amount Additions
Acquisitions
from business
combinations Depreciation Other 1
Net carrying
amount
Land and buildings 632 19 – (28) – 623
Cable and wireless network 6,910 1,453 6 (1,179) 11 7,201
Computer equipment and software 1,522 465 – (371) (9) 1,607
Customer premise equipment 594 269 – (303) (5) 555
Leasehold improvements 221 43 3 (27) (8) 232
Equipment and vehicles 376 117 – (71) 15 437
Total property, plant and equipment 10,255 2,366 9 (1,979) 4 10,655
1Includes disposals, write-downs, reclassifications, and other adjustments.
Property, plant and equipment not yet in service and therefore not depreciated as at December 31, 2015 was $1,017 million
(2014 – $1,048 million). During 2015, capitalized interest pertaining to property, plant and equipment was recognized at a weighted
average rate of approximately 4.0% (2014 – 4.6%).
2015 ANNUAL REPORT ROGERS COMMUNICATIONS INC. 105