Rogers 2015 Annual Report Download - page 25
Download and view the complete annual report
Please find page 25 of the 2015 Rogers annual report below. You can navigate through the pages in the report by either clicking on the pages listed below, or by using the keyword search tool below to find specific information within the annual report.-
 1
1 -
2
-
3
-
4
-
5
-
6
-
7
-
8
-
9
-
10
-
11
-
12
-
13
-
14
-
 15
15 -
 16
16 -
 17
17 -
 18
18 -
 19
19 -
 20
20 -
 21
21 -
 22
22 -
 23
23 -
 24
24 -
 25
25 -
 26
26 -
 27
27 -
 28
28 -
 29
29 -
 30
30 -
 31
31 -
 32
32 -
 33
33 -
 34
34 -
 35
35 -
36
-
37
-
38
-
39
-
40
-
41
-
42
-
43
-
44
-
45
-
46
-
47
-
48
-
49
-
50
-
51
-
52
-
53
-
54
-
55
-
56
-
57
-
58
-
59
-
60
-
61
-
62
-
63
-
64
-
65
-
66
-
67
-
68
-
69
-
70
-
71
-
72
-
73
-
74
-
75
-
76
-
77
-
78
-
79
-
80
-
81
-
82
-
83
-
84
-
85
-
86
-
87
-
88
-
89
-
90
-
91
-
92
-
93
-
94
-
95
-
96
-
97
-
98
-
99
-
100
-
101
-
102
-
103
-
104
-
105
-
106
-
107
-
108
-
109
-
110
-
111
-
112
-
113
-
114
-
115
-
116
-
117
-
118
-
119
-
120
-
121
-
122
-
123
-
124
-
125
-
126
-
127
-
128
-
129
-
130
-
131
-
132
-
133
-
134
-
135
-
136
-
137
-
138
-
139
-
140
-
141
-
142
-
143
-
144
-
145
-
146
 |
 |

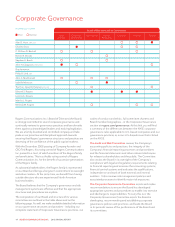
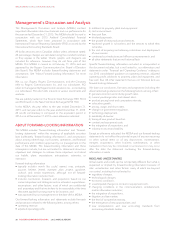
MANAGEMENT’S DISCUSSION AND ANALYSIS
2015 HIGHLIGHTS
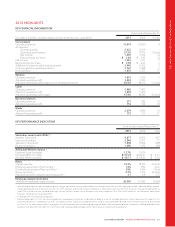
KEY FINANCIAL INFORMATION
Years ended December 31
(In millions of dollars, except margins and per share amounts, unaudited) 2015 2014 % Chg
Consolidated
Operating revenue 13,414 12,850 4
As adjusted 1:
Operating profit 5,032 5,019 –
Operating profit margin 37.5% 39.1% (1.6 pts)
Net income 1,490 1,532 (3)
Basic earnings per share $2.89 $2.97 (3)
Net income 1,381 1,341 3
Basic earnings per share $2.68 $2.60 3
Additions to property, plant and equipment 2,440 2,366 3
Cash provided by operating activities 3,747 3,698 1
Free cash flow 11,676 1,437 17
Wireless
Operating revenue 7,651 7,305 5
Adjusted operating profit 3,239 3,246 –
Adjusted operating profit margin as a % of network revenue 46.9% 48.1% (1.2 pts)
Cable
Operating revenue 3,465 3,467 –
Adjusted operating profit 1,658 1,665 –
Adjusted operating profit margin 47.8% 48.0% (0.2 pts)
Business Solutions
Operating revenue 377 382 (1)
Adjusted operating profit 116 122 (5)
Media
Operating revenue 2,079 1,826 14
Adjusted operating profit 172 131 31
KEY PERFORMANCE INDICATORS
As at or years ended December 31
2015 2014 Chg
Subscriber count results (000s) 2
Wireless subscribers 9,877 9,450 427
Internet subscribers 2,048 2,011 37
Television subscribers 1,896 2,024 (128)
Phone subscribers 1,090 1,150 (60)
Additional Wireless metrics 2
Postpaid churn (monthly) 1.27% 1.27% –
Postpaid ARPA (monthly) $110.74 $106.41 $ 4.33
Blended ARPU (monthly) $ 59.71 $ 59.41 $ 0.30
Ratios
Capital intensity 218.2% 18.4% (0.2 pts)
Dividend payout ratio of net income 272% 70% 2 pts
Dividend payout ratio of free cash flow 1, 2 59% 66% (7 pts)
Return on assets 24.7% 5.1% (0.4 pts)
Adjusted net debt / adjusted operating profit 1, 3 3.1 2.9 0.2
Employee-related information
Total active employees (approximate) 26,000 27,000 (1,000)
1Adjusted operating profit, adjusted operating profit margin, adjusted net income, adjusted basic earnings per share, free cash flow, adjusted net debt / adjusted operating profit,
and dividend payout ratio of free cash flow are non-GAAP measures and should not be considered as a substitute or alternative for GAAP measures. They are not defined terms
under IFRS, and do not have standard meanings, so may not be a reliable way to compare us to other companies. See “Non-GAAP Measures” for information about these
measures, including how we calculate them.
2As defined. See “Key Performance Indicators”.
3Effective September 30, 2015, we have retrospectively amended our calculation of adjusted net debt to value the net debt derivatives without adjustment for credit risk. For
accounting purposes in accordance with IFRS, we recognize the fair values of our debt derivatives using an estimated credit-adjusted mark-to-market valuation by discounting
cash flows to the measurement date. For purposes of calculating adjusted net debt and adjusted net debt / adjusted operating profit, we believe including debt derivatives
valued without adjustment for credit risk is commonly used to evaluate debt leverage and for market valuation and transactional purposes.
2015 ANNUAL REPORT ROGERS COMMUNICATIONS INC. 23