Rogers 2015 Annual Report Download - page 26
Download and view the complete annual report
Please find page 26 of the 2015 Rogers annual report below. You can navigate through the pages in the report by either clicking on the pages listed below, or by using the keyword search tool below to find specific information within the annual report.-
 1
1 -
2
-
3
-
4
-
5
-
6
-
7
-
8
-
9
-
10
-
11
-
12
-
13
-
14
-
15
-
 16
16 -
 17
17 -
 18
18 -
 19
19 -
 20
20 -
 21
21 -
 22
22 -
 23
23 -
 24
24 -
 25
25 -
 26
26 -
 27
27 -
 28
28 -
 29
29 -
 30
30 -
 31
31 -
 32
32 -
 33
33 -
 34
34 -
 35
35 -
 36
36 -
37
-
38
-
39
-
40
-
41
-
42
-
43
-
44
-
45
-
46
-
47
-
48
-
49
-
50
-
51
-
52
-
53
-
54
-
55
-
56
-
57
-
58
-
59
-
60
-
61
-
62
-
63
-
64
-
65
-
66
-
67
-
68
-
69
-
70
-
71
-
72
-
73
-
74
-
75
-
76
-
77
-
78
-
79
-
80
-
81
-
82
-
83
-
84
-
85
-
86
-
87
-
88
-
89
-
90
-
91
-
92
-
93
-
94
-
95
-
96
-
97
-
98
-
99
-
100
-
101
-
102
-
103
-
104
-
105
-
106
-
107
-
108
-
109
-
110
-
111
-
112
-
113
-
114
-
115
-
116
-
117
-
118
-
119
-
120
-
121
-
122
-
123
-
124
-
125
-
126
-
127
-
128
-
129
-
130
-
131
-
132
-
133
-
134
-
135
-
136
-
137
-
138
-
139
-
140
-
141
-
142
-
143
-
144
-
145
-
146
 |
 |

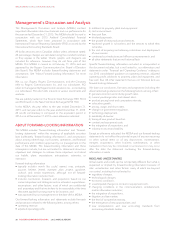
MANAGEMENT’S DISCUSSION AND ANALYSIS
KEY ACHIEVEMENTS
HIGHER OPERATING REVENUE
• Consolidated revenue increased by 4% this year, reflecting
revenue growth of 5% in Wireless and 14% in Media, while
Cable revenue remained stable and Business Solutions revenue
decreased by 1%. Wireless revenue increased on higher network
revenue from the continued adoption of higher-postpaid-ARPA-
generating Rogers Share Everything plans and greater
smartphone sales. Cable revenue was stable as the increase in
Internet revenue from the movement of customers to higher-end
speed and usage tiers was offset by lower Television and Phone
revenue primarily due to Television and Phone subscriber losses
over the past year. Business Solutions revenue decreased this
year primarily as a result of the continued reduction in lower
margin, off-net legacy revenue, which more than offset the
growth in on-net next generation services, including our data
centre businesses. Media revenue increased as a result of the
National Hockey League (NHL) licensing agreement, growth at
Sportsnet, and higher revenue at the Toronto Blue Jays, partially
offset by lower sales at The Shopping Channel (TSC) and
continued softness in conventional broadcast TV and print
advertising.
• Consolidated adjusted operating profit was stable this year, with
a consolidated adjusted operating profit margin of 37.5%,
resulting from higher revenue offset by higher net subsidies in
Wireless and higher operating expenses in Media. Our net
income increased 3% to $1,381 million, mainly due to lower
restructuring, acquisition and other costs, finance costs, and
income taxes, partially offset by higher depreciation and
amortization.
• Postpaid Wireless subscriber net additions of 106,000 and
Internet net additions of 37,000 this year.
HIGHER CASH FLOW
• Free cash flow increased 17% this year to $1,676 million as a
result of lower cash income tax payments, partially offset by
higher additions to property, plant and equipment. Our cash
provided by operating activities increased 1% this year to
$3,747 million.
LIQUIDITY POSITION
• Ended the year with approximately $3.3 billion of available
liquidity (2014 – $2.8 billion), comprised of $0.01 billion cash on
hand (2014 – $0.2 billion), $3.0 billion available under our bank
credit facilities (2014 – $2.5 billion), and $0.25 billion available
under our $1.05 billion accounts receivable securitization
program (2014 – $0.06 billion available under our $0.9 billion
accounts receivable securitization program).
• Issued US$1,000 million ($1,338 million) of senior notes,
consisting of US$700 million ($937 million) 3.625% senior notes
due 2025 and US$300 million ($401 million) 5.000% senior
notes due 2044.
• Our overall weighted average cost of borrowings was 4.82% as
at December 31, 2015 (2014 – 5.20%) and our overall weighted
average term to maturity on our debt was 10.8 years as at
December 31, 2015 (2014 – 10.8 years).
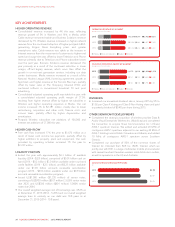
(IN MILLIONS OF DOLLARS)
OPERATING REVENUE BY SEGMENT
2015
2014
2013
2,079 377 3,465 7,651
1,826 382 3,467 7,3 0 5
1,704 374 3,475 7,270
WirelessCableBusiness SolutionsMedia
(IN MILLIONS OF DOLLARS)
ADJUSTED OPERATING PROFIT BY SEGMENT
2015
2014
2013
172 116 1,658 3,239
131 122 1,665 3,246
161 106 1,718 3,157
WirelessCableBusiness SolutionsMedia
DIVIDENDS
• Increased our annualized dividend rate in January 2015 by 5% to
$1.92 per Class A Voting and Class B Non-Voting share and paid
a quarterly dividend of $0.48 per share during 2015.
OTHER SIGNIFICANT DEVELOPMENTS
• Completed the strategic acquisition of wireless provider Data &
Audio-Visual Enterprises Wireless Inc. (Mobilicity) and completed
the transaction to acquire Shaw Communication Inc.’s (Shaw)
AWS-1 spectrum licences. We added and activated 20 MHz of
contiguous AWS-1 spectrum adjacent to our existing 20 MHz of
AWS-1 holdings across British Columbia and Alberta, and added
10 MHz of contiguous AWS-1 spectrum across Southern
Ontario.
• Completed our purchase of 50% of the common shares of
GlentelInc.(Glentel)fromBCEInc.(BCE).Glentel,whichwe
jointly own with BCE, is a large, multicarrier mobile phone retailer
with several hundred Canadian wireless retail distribution outlets,
as well as operations in the US and Australia.
($)
ADJUSTED BASIC EARNINGS PER SHARE
2015
2014
2013
$2.89
$2.97
$3.43
24 ROGERS COMMUNICATIONS INC. 2015 ANNUAL REPORT