Reebok 2015 Annual Report Download - page 99
Download and view the complete annual report
Please find page 99 of the 2015 Reebok annual report below. You can navigate through the pages in the report by either clicking on the pages listed below, or by using the keyword search tool below to find specific information within the annual report.-
 1
1 -
2
-
3
-
4
-
5
-
6
-
7
-
8
-
9
-
10
-
11
-
12
-
13
-
14
-
15
-
16
-
17
-
18
-
19
-
20
-
21
-
22
-
23
-
24
-
25
-
26
-
27
-
28
-
29
-
30
-
31
-
32
-
33
-
34
-
35
-
36
-
37
-
38
-
39
-
40
-
41
-
42
-
43
-
44
-
45
-
46
-
47
-
48
-
49
-
50
-
51
-
52
-
53
-
54
-
55
-
56
-
57
-
58
-
59
-
60
-
61
-
62
-
63
-
64
-
65
-
66
-
67
-
68
-
69
-
70
-
71
-
72
-
73
-
74
-
75
-
76
-
77
-
78
-
79
-
80
-
81
-
82
-
83
-
84
-
85
-
86
-
87
-
88
-
 89
89 -
 90
90 -
 91
91 -
 92
92 -
 93
93 -
 94
94 -
 95
95 -
 96
96 -
 97
97 -
 98
98 -
 99
99 -
 100
100 -
 101
101 -
 102
102 -
 103
103 -
 104
104 -
 105
105 -
 106
106 -
 107
107 -
 108
108 -
 109
109 -
110
-
111
-
112
-
113
-
114
-
115
-
116
-
117
-
118
-
119
-
120
-
121
-
122
-
123
-
124
-
125
-
126
-
127
-
128
-
129
-
130
-
131
-
132
-
133
-
134
-
135
-
136
-
137
-
138
-
139
-
140
-
141
-
142
-
143
-
144
-
145
-
146
-
147
-
148
-
149
-
150
-
151
-
152
-
153
-
154
-
155
-
156
-
157
-
158
-
159
-
160
-
161
-
162
-
163
-
164
-
165
-
166
-
167
-
168
-
169
-
170
-
171
-
172
-
173
-
174
-
175
-
176
-
177
-
178
-
179
-
180
-
181
-
182
-
183
-
184
-
185
-
186
-
187
-
188
-
189
-
190
-
191
-
192
-
193
-
194
-
195
-
196
-
197
-
198
-
199
-
200
-
201
-
202
-
203
-
204
-
205
-
206
-
207
-
208
-
209
-
210
-
211
-
212
-
213
-
214
-
215
-
216
-
217
-
218
-
219
-
220
-
221
-
222
-
223
-
224
-
225
-
226
-
227
-
228
-
229
-
230
-
231
-
232
-
233
-
234
-
235
-
236
-
237
-
238
-
239
-
240
-
241
-
242
-
243
-
244
-
245
-
246
-
247
-
248
-
249
-
250
-
251
-
252
-
253
-
254
-
255
-
256
-
257
-
258
-
259
-
260
-
261
-
262
-
263
-
264
-
265
-
266
-
267
-
268
-
269
-
270
 |
 |
GROUP MANAGEMENT REPORT – OUR GROUP
Sustainability
95
2
•Factory visits: During 2015, we conducted 1,255 factory visits (2014: 1,320 visits) comprising different
types of audits (including chemical management audits), trainings and meetings with factory management
as well as employees at various levels in our supply chain. In addition to our own monitoring activities,
we value independent and unannounced assessment by third parties to demonstrate the credibility of
and provide verified information about our programme to stakeholders. As a member of the Fair Labor
Association (FLA), the adidas Group is subject to external assessment by independent monitors, partici-
pation in the FLA third-party complaint system and public reporting. Since joining the organisation in
1999, the monitoring programme of the adidas Group has been accredited twice by the FLA. During
this period, more than 300 independent assessments have been conducted at adidas Group suppliers.
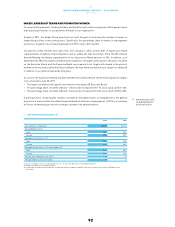
•Compliance rating: According to the results of factory inspections, suppliers are assessed with a score
between 1C and 5C, with 5C being the best rating. The rating results are shared with our Sourcing
teams which then decide whether and to which extent we continue the business relationship with a
specific supplier. In 2015, we saw a further decline in the number of low-performing suppliers (1C and
2C) and at the same time a notable increase of suppliers qualifying for self-governance (factories that
have reached 4C or 5C status). More supplier factories qualifying for self-governance status means
that factories have proven to operate effective human resources, health and safety as well as environ-
mental management systems by themselves. As a result, we were able to reduce the number of factory
visits in 2015 compared to the prior year. Overall, 68% (2014: 64%) of our direct suppliers have received
a 3C (good) or better rating.
01COMPLIANCE RATINGS
Grade KPI score band Performance description
1C 0% – 29% There are numerous severe non-compliance issues and no compliance management and compliance practices
in place. The factory has been given notice that business will be terminated unless there is immediate
improvement.
2C 30% – 59% There are some non-compliance issues and no compliance management systems. However, there are some
effective compliance practices being delivered.
3C 60% – 79% There are minor non-compliance issues. The factory has compliance management systems and some effective
compliance practices in place.
4C 80% – 89% Generally, there are no non-compliance issues. The factory has compliance management systems in place,
and most of the components are effective.
5C 90% – 100% There are no non-compliance issues and all of the factory's management systems and practices are well
delivered and effective.
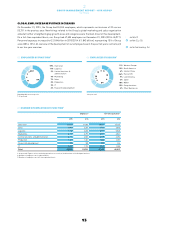
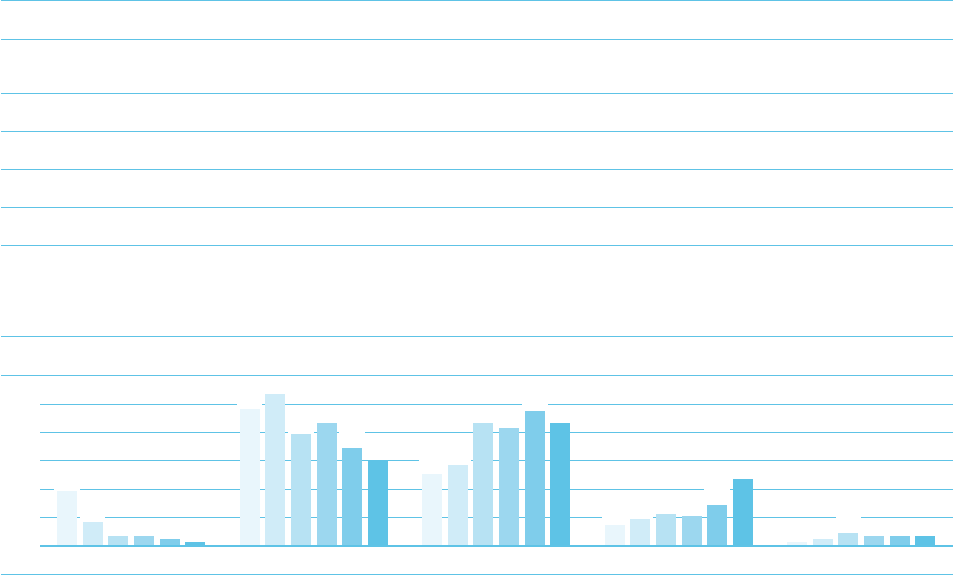
02DEVELOPMENT BYCOMPLIANCE RATINGS 1IN %
1C 2C 3C 4C 5C
50
40
30
20
10
0
■
2010
■
2011
■
2012
■
2013
■
2014
■
2015
1 The table presents the C-KPI percentage of direct suppliers. Please note that in 2012 we moved to a KPI reporting methodology that only considers the latest KPI score of each supplier,
instead of taking the average of all previous KPI scores into account.
8
53
28
9
2
3
43 41
10
3
19
48
25
7
1
3
39 43
11
4
2
34
47
14
3
1
30
43
23
3