Reebok 2015 Annual Report Download - page 238
Download and view the complete annual report
Please find page 238 of the 2015 Reebok annual report below. You can navigate through the pages in the report by either clicking on the pages listed below, or by using the keyword search tool below to find specific information within the annual report.-
 1
1 -
2
-
3
-
4
-
5
-
6
-
7
-
8
-
9
-
10
-
11
-
12
-
13
-
14
-
15
-
16
-
17
-
18
-
19
-
20
-
21
-
22
-
23
-
24
-
25
-
26
-
27
-
28
-
29
-
30
-
31
-
32
-
33
-
34
-
35
-
36
-
37
-
38
-
39
-
40
-
41
-
42
-
43
-
44
-
45
-
46
-
47
-
48
-
49
-
50
-
51
-
52
-
53
-
54
-
55
-
56
-
57
-
58
-
59
-
60
-
61
-
62
-
63
-
64
-
65
-
66
-
67
-
68
-
69
-
70
-
71
-
72
-
73
-
74
-
75
-
76
-
77
-
78
-
79
-
80
-
81
-
82
-
83
-
84
-
85
-
86
-
87
-
88
-
89
-
90
-
91
-
92
-
93
-
94
-
95
-
96
-
97
-
98
-
99
-
100
-
101
-
102
-
103
-
104
-
105
-
106
-
107
-
108
-
109
-
110
-
111
-
112
-
113
-
114
-
115
-
116
-
117
-
118
-
119
-
120
-
121
-
122
-
123
-
124
-
125
-
126
-
127
-
128
-
129
-
130
-
131
-
132
-
133
-
134
-
135
-
136
-
137
-
138
-
139
-
140
-
141
-
142
-
143
-
144
-
145
-
146
-
147
-
148
-
149
-
150
-
151
-
152
-
153
-
154
-
155
-
156
-
157
-
158
-
159
-
160
-
161
-
162
-
163
-
164
-
165
-
166
-
167
-
168
-
169
-
170
-
171
-
172
-
173
-
174
-
175
-
176
-
177
-
178
-
179
-
180
-
181
-
182
-
183
-
184
-
185
-
186
-
187
-
188
-
189
-
190
-
191
-
192
-
193
-
194
-
195
-
196
-
197
-
198
-
199
-
200
-
201
-
202
-
203
-
204
-
205
-
206
-
207
-
208
-
209
-
210
-
211
-
212
-
213
-
214
-
215
-
216
-
217
-
218
-
219
-
220
-
221
-
222
-
223
-
224
-
225
-
226
-
227
-
 228
228 -
 229
229 -
 230
230 -
 231
231 -
 232
232 -
 233
233 -
 234
234 -
 235
235 -
 236
236 -
 237
237 -
 238
238 -
 239
239 -
 240
240 -
 241
241 -
 242
242 -
 243
243 -
 244
244 -
 245
245 -
 246
246 -
 247
247 -
 248
248 -
249
-
250
-
251
-
252
-
253
-
254
-
255
-
256
-
257
-
258
-
259
-
260
-
261
-
262
-
263
-
264
-
265
-
266
-
267
-
268
-
269
-
270
 |
 |

234
4
CONSOLIDATED FINANCIAL STATEMENTS
Notes – Notes to the Consolidated Statement of Financial Position
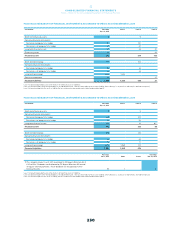
The comparatively high amount of forward exchange contracts is primarily due to currency swaps for
liquidity management purposes and hedging transactions.
Of the total amount of outstanding hedges, the following contracts related to the US dollar (i.e. the
biggest single exposure of product sourcing):
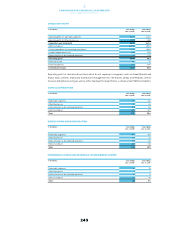
NOTIONAL AMOUNTS OF OUTSTANDING US DOLLAR HEDGING INSTRUMENTS
€ in millions Dec. 31, 2015 Dec. 31, 2014
Forward exchange contracts 4,286 3,192
Currency options 0 278
Total 4,286 3,470
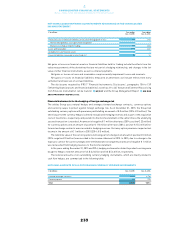
The fair value of all outstanding currency hedging instruments is as follows:
FAIR VALUES
€ in millions Dec. 31, 2015 Dec. 31, 2014
Positive
fair value
Negative
fair value
Positive
fair value
Negative
fair value
Forward exchange contracts 204 (59) 245 (50)
Currency options 0 (1) 26 (0)
Total 204 (60) 271 (50)
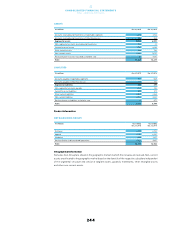
A total net fair value of positive € 146 million (2014: positive € 163 million) for forward exchange contracts
related to hedging instruments falling under hedge accounting as per definition of IAS 39 ‘Financial
Instruments: Recognition and Measurement’ was recorded in the hedging reserve. The remaining net fair
value of negative € 2 million (2014: positive € 32 million), mainly related to currency swaps for liquidity
management purposes and to forward exchange contracts hedging intercompany dividend receivables, was
recorded in the income statement. The total fair value of negative € 1 million (2014: positive € 26 million) for
outstanding currency options related to cash flow hedges. This consists of a positive time value of € 1 million
(2014: positive € 0 million) and of a negative time value of € 0 million (2014: negative € 0 million) and, in
contrast to the preceding table above, does not include the intrinsic value of the options.
The fair value adjustments of outstanding cash flow hedges for forecasted sales are reported in
the income statement when the forecasted sales transactions are recorded. The vast majority of these
transactions are forecasted to occur in 2016. At the balance sheet date, inventories were adjusted by
positive € 26 million (2014: negative € 1 million) which will be recognised in the income statement in 2016.
In the hedging reserve, a negative amount of € 56 million (2014: negative € 4 million) is included for
hedging the currency risk of net investments in foreign entities, mainly for the subsidiaries LLC “adidas, Ltd.”
and adidas Sports (China) Co. Ltd. This reserve will remain until the investment in the foreign entity has
been sold. As at December 31, 2015, no ineffective part of the hedges was recorded in the income statement.
In order to determine the fair values of its derivatives that are not publicly traded, the adidas Group
uses generally accepted quantitative financial models based on market conditions prevailing at the balance
sheet date.
In 2015, the fair values of the derivatives were determined applying mainly the ‘par method’, which
uses actively traded forward rates.