Reebok 2015 Annual Report Download - page 172
Download and view the complete annual report
Please find page 172 of the 2015 Reebok annual report below. You can navigate through the pages in the report by either clicking on the pages listed below, or by using the keyword search tool below to find specific information within the annual report.-
 1
1 -
2
-
3
-
4
-
5
-
6
-
7
-
8
-
9
-
10
-
11
-
12
-
13
-
14
-
15
-
16
-
17
-
18
-
19
-
20
-
21
-
22
-
23
-
24
-
25
-
26
-
27
-
28
-
29
-
30
-
31
-
32
-
33
-
34
-
35
-
36
-
37
-
38
-
39
-
40
-
41
-
42
-
43
-
44
-
45
-
46
-
47
-
48
-
49
-
50
-
51
-
52
-
53
-
54
-
55
-
56
-
57
-
58
-
59
-
60
-
61
-
62
-
63
-
64
-
65
-
66
-
67
-
68
-
69
-
70
-
71
-
72
-
73
-
74
-
75
-
76
-
77
-
78
-
79
-
80
-
81
-
82
-
83
-
84
-
85
-
86
-
87
-
88
-
89
-
90
-
91
-
92
-
93
-
94
-
95
-
96
-
97
-
98
-
99
-
100
-
101
-
102
-
103
-
104
-
105
-
106
-
107
-
108
-
109
-
110
-
111
-
112
-
113
-
114
-
115
-
116
-
117
-
118
-
119
-
120
-
121
-
122
-
123
-
124
-
125
-
126
-
127
-
128
-
129
-
130
-
131
-
132
-
133
-
134
-
135
-
136
-
137
-
138
-
139
-
140
-
141
-
142
-
143
-
144
-
145
-
146
-
147
-
148
-
149
-
150
-
151
-
152
-
153
-
154
-
155
-
156
-
157
-
158
-
159
-
160
-
161
-
 162
162 -
 163
163 -
 164
164 -
 165
165 -
 166
166 -
 167
167 -
 168
168 -
 169
169 -
 170
170 -
 171
171 -
 172
172 -
 173
173 -
 174
174 -
 175
175 -
 176
176 -
 177
177 -
 178
178 -
 179
179 -
 180
180 -
 181
181 -
 182
182 -
183
-
184
-
185
-
186
-
187
-
188
-
189
-
190
-
191
-
192
-
193
-
194
-
195
-
196
-
197
-
198
-
199
-
200
-
201
-
202
-
203
-
204
-
205
-
206
-
207
-
208
-
209
-
210
-
211
-
212
-
213
-
214
-
215
-
216
-
217
-
218
-
219
-
220
-
221
-
222
-
223
-
224
-
225
-
226
-
227
-
228
-
229
-
230
-
231
-
232
-
233
-
234
-
235
-
236
-
237
-
238
-
239
-
240
-
241
-
242
-
243
-
244
-
245
-
246
-
247
-
248
-
249
-
250
-
251
-
252
-
253
-
254
-
255
-
256
-
257
-
258
-
259
-
260
-
261
-
262
-
263
-
264
-
265
-
266
-
267
-
268
-
269
-
270
 |
 |

168
3
GROUP MANAGEMENT REPORT – FINANCIAL REVIEW
Risk and Opportunity Report – Illustration of Material Risks
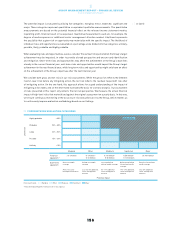
In line with IFRS 7 requirements, we have calculated the impact on net income and shareholders’ equity
based on changes in our most important currency exchange rates. The calculated impacts mainly result
from changes in the fair value of our hedging instruments. The analysis does not include effects that arise
from the translation of our foreign entities’ financial statements into the Group’s reporting currency, the
euro. The sensitivity analysis is based on the net balance sheet exposure, including intercompany balances
from monetary assets and liabilities denominated in foreign currencies. Moreover, all outstanding currency
derivatives were re-evaluated using hypothetical foreign exchange rates to determine the effects on net
income and equity. The analysis was performed on the same basis for both 2014 and 2015.
Based on this analysis, a 10% increase in the euro versus the US dollar at December 31, 2015 would have
led to a € 7 million increase in net income. The more negative market values of the US dollar hedges would
have decreased shareholders’ equity by € 225 million. A 10% weaker euro at December 31, 2015 would have
led to a € 9 million decrease in net income. Shareholders’ equity would have increased by € 238 million.
The impacts of fluctuations of the US dollar against the Russian rouble and of the euro against the British
pound and the Japanese yen on net income and shareholders’ equity are also included in accordance with
IFRS requirements.
However, many other financial and operational variables that could potentially reduce the effect of currency
fluctuations are excluded from the analysis. For instance:
•Interest rates, commodity prices and all other exchange rates are assumed constant.
•Exchange rates are assumed at a year-end value instead of the more relevant sales-weighted average
figure, which we utilise internally to better reflect both the seasonality of our business and intra-year
currency fluctuations.
•The underlying forecasted cash flow exposure (which the hedge instrument mainly relates to) is not
required to be revalued in this analysis.
•
Operational issues, such as potential discounts to key accounts, which have high transparency regarding
the impacts of currency on our sourcing activities (due to their own private label sourcing efforts), are
also excluded from this presentation.
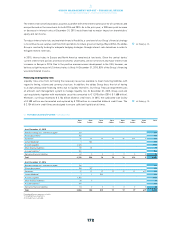
Utilising a centralised currency risk management system, our Group hedges currency needs for projected
sourcing requirements on a rolling basis up to 24 months in advance. In rare instances, hedges are
contracted beyond the 24-month horizon. Our goal is to have the vast majority of our hedging volume
secured six months prior to the start of a given season. The Group also largely hedges balance sheet risks.
Due to our strong global position, we are able to partly minimise currency risk by utilising natural hedges.
Our gross US dollar cash flow exposure after natural hedges calculated for 2016 was roughly € 6.3 billion
at year-end 2015, which we hedged using forward exchange contracts, currency options and currency
swaps. Our Group’s Treasury Policy allows us to utilise hedging instruments, such as currency options
or option combinations, which provide protection from negative exchange rate fluctuations while – at the
same time – retaining the potential to benefit from future favourable exchange rate developments in the
financial markets.
As 2016 hedging has almost been completed, it is clear that the EUR/USD conversion rate will be less
favourable compared to 2015. Volume forecast variances and currency volatility in emerging markets (in
particular Argentina and Russia), where currencies depreciated rapidly in 2015 and at the beginning of
2016, will expose the adidas Group to substantial currency effects in 2016.
see Table 05
see Treasury, p. 124
see Table 04
see Subsequent Events
and Outlook, p. 148