Reebok 2015 Annual Report Download - page 260
Download and view the complete annual report
Please find page 260 of the 2015 Reebok annual report below. You can navigate through the pages in the report by either clicking on the pages listed below, or by using the keyword search tool below to find specific information within the annual report.-
 1
1 -
2
-
3
-
4
-
5
-
6
-
7
-
8
-
9
-
10
-
11
-
12
-
13
-
14
-
15
-
16
-
17
-
18
-
19
-
20
-
21
-
22
-
23
-
24
-
25
-
26
-
27
-
28
-
29
-
30
-
31
-
32
-
33
-
34
-
35
-
36
-
37
-
38
-
39
-
40
-
41
-
42
-
43
-
44
-
45
-
46
-
47
-
48
-
49
-
50
-
51
-
52
-
53
-
54
-
55
-
56
-
57
-
58
-
59
-
60
-
61
-
62
-
63
-
64
-
65
-
66
-
67
-
68
-
69
-
70
-
71
-
72
-
73
-
74
-
75
-
76
-
77
-
78
-
79
-
80
-
81
-
82
-
83
-
84
-
85
-
86
-
87
-
88
-
89
-
90
-
91
-
92
-
93
-
94
-
95
-
96
-
97
-
98
-
99
-
100
-
101
-
102
-
103
-
104
-
105
-
106
-
107
-
108
-
109
-
110
-
111
-
112
-
113
-
114
-
115
-
116
-
117
-
118
-
119
-
120
-
121
-
122
-
123
-
124
-
125
-
126
-
127
-
128
-
129
-
130
-
131
-
132
-
133
-
134
-
135
-
136
-
137
-
138
-
139
-
140
-
141
-
142
-
143
-
144
-
145
-
146
-
147
-
148
-
149
-
150
-
151
-
152
-
153
-
154
-
155
-
156
-
157
-
158
-
159
-
160
-
161
-
162
-
163
-
164
-
165
-
166
-
167
-
168
-
169
-
170
-
171
-
172
-
173
-
174
-
175
-
176
-
177
-
178
-
179
-
180
-
181
-
182
-
183
-
184
-
185
-
186
-
187
-
188
-
189
-
190
-
191
-
192
-
193
-
194
-
195
-
196
-
197
-
198
-
199
-
200
-
201
-
202
-
203
-
204
-
205
-
206
-
207
-
208
-
209
-
210
-
211
-
212
-
213
-
214
-
215
-
216
-
217
-
218
-
219
-
220
-
221
-
222
-
223
-
224
-
225
-
226
-
227
-
228
-
229
-
230
-
231
-
232
-
233
-
234
-
235
-
236
-
237
-
238
-
239
-
240
-
241
-
242
-
243
-
244
-
245
-
246
-
247
-
248
-
249
-
 250
250 -
 251
251 -
 252
252 -
 253
253 -
 254
254 -
 255
255 -
 256
256 -
 257
257 -
 258
258 -
 259
259 -
 260
260 -
 261
261 -
 262
262 -
 263
263 -
 264
264 -
 265
265 -
 266
266 -
 267
267 -
 268
268 -
 269
269 -
 270
270
 |
 |
ADDITIONAL INFORMATION
Ten-Year Overview
256
5
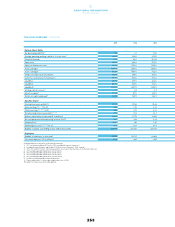
TEN-YEAR OVERVIEW
Rounding differences may arise in percentages and totals.
1 2011 restated according to IAS 8 in the 2012 consolidated financial statements.
2 Including Reebok, Rockport and Reebok-CCM Hockey from February 1, 2006 onwards.
3 2015, 2014 and 2013 reflect continuing operations as a result of the divestiture of the Rockport business.
4 2015 excluding goodwill impairment of € 34 million.
5 2014 excluding goodwill impairment of € 78 million.
6 2013 excluding goodwill impairment of € 52 million.
7 2012 excluding goodwill impairment of € 265 million.
8 Includes continuing and discontinued operations.
9 Figures adjusted for 1:4 share split conducted on June 6, 2006.
10 Subject to Annual General Meeting approval.
TEN-YEAR OVERVIEW
2015 2014 2013
Income Statement Data (€ in millions)
Net sales 316,915 14,534 14,203
Gross profit 38,168 6,924 7,001
Royalty and commission income 3119 102 103
Other operating income 396 138 142
Other operating expenses 37,289 6,203 6,013
EBITDA 31,475 1,283 1,496
Operating profit 3, 4, 5, 6, 7 1,094 961 1,233
Net financial result (21) (48) (68)
Income before taxes 3, 4, 5, 6, 7 1,073 913 1,165
Income taxes 3353 271 340
Net income attributable to non-controlling interests 6 6 3
Net income attributable to shareholders 4, 5, 6, 7, 8 668 568 839
Income Statement Ratios
Gross margin 348.3% 47.6% 49.3%
Operating margin 3, 4, 5, 6, 7 6.5% 6.6% 8.7%
Interest coverage 323.8 19.3 24.0
Effective tax rate 3, 4, 5, 6, 7 32.9% 29.7% 29.2%
Net income attributable to shareholders in % of net sales 4, 5, 6, 7, 8 4.0% 3.9% 5.9%
Net Sales by Brand (€ in millions)
adidas 13,939 11,774 11,059
Reebok 1,751 1,578 1,599
TaylorMade-adidas Golf 902 913 1,285
Reebok-CCM Hockey 317 269 260
Net Sales by Product Category (€ in millions)
Footwear 38,360 6,658 6,587
Apparel 36,970 6,279 5,811
Hardware 31,585 1,597 1,806
Balance Sheet Data (€ in millions)
Total assets 13,343 12,417 11,599
Inventories 3,113 2,526 2,634
Receivables and other current assets 3,003 2,861 2,583
Working capital 2,133 2,970 2,125
Net cash/(net borrowings) (460) (185) 295
Shareholders’ equity 5,666 5,624 5,489