Reebok 2015 Annual Report Download - page 112
Download and view the complete annual report
Please find page 112 of the 2015 Reebok annual report below. You can navigate through the pages in the report by either clicking on the pages listed below, or by using the keyword search tool below to find specific information within the annual report.-
 1
1 -
2
-
3
-
4
-
5
-
6
-
7
-
8
-
9
-
10
-
11
-
12
-
13
-
14
-
15
-
16
-
17
-
18
-
19
-
20
-
21
-
22
-
23
-
24
-
25
-
26
-
27
-
28
-
29
-
30
-
31
-
32
-
33
-
34
-
35
-
36
-
37
-
38
-
39
-
40
-
41
-
42
-
43
-
44
-
45
-
46
-
47
-
48
-
49
-
50
-
51
-
52
-
53
-
54
-
55
-
56
-
57
-
58
-
59
-
60
-
61
-
62
-
63
-
64
-
65
-
66
-
67
-
68
-
69
-
70
-
71
-
72
-
73
-
74
-
75
-
76
-
77
-
78
-
79
-
80
-
81
-
82
-
83
-
84
-
85
-
86
-
87
-
88
-
89
-
90
-
91
-
92
-
93
-
94
-
95
-
96
-
97
-
98
-
99
-
100
-
101
-
 102
102 -
 103
103 -
 104
104 -
 105
105 -
 106
106 -
 107
107 -
 108
108 -
 109
109 -
 110
110 -
 111
111 -
 112
112 -
 113
113 -
 114
114 -
 115
115 -
 116
116 -
 117
117 -
 118
118 -
 119
119 -
 120
120 -
 121
121 -
 122
122 -
123
-
124
-
125
-
126
-
127
-
128
-
129
-
130
-
131
-
132
-
133
-
134
-
135
-
136
-
137
-
138
-
139
-
140
-
141
-
142
-
143
-
144
-
145
-
146
-
147
-
148
-
149
-
150
-
151
-
152
-
153
-
154
-
155
-
156
-
157
-
158
-
159
-
160
-
161
-
162
-
163
-
164
-
165
-
166
-
167
-
168
-
169
-
170
-
171
-
172
-
173
-
174
-
175
-
176
-
177
-
178
-
179
-
180
-
181
-
182
-
183
-
184
-
185
-
186
-
187
-
188
-
189
-
190
-
191
-
192
-
193
-
194
-
195
-
196
-
197
-
198
-
199
-
200
-
201
-
202
-
203
-
204
-
205
-
206
-
207
-
208
-
209
-
210
-
211
-
212
-
213
-
214
-
215
-
216
-
217
-
218
-
219
-
220
-
221
-
222
-
223
-
224
-
225
-
226
-
227
-
228
-
229
-
230
-
231
-
232
-
233
-
234
-
235
-
236
-
237
-
238
-
239
-
240
-
241
-
242
-
243
-
244
-
245
-
246
-
247
-
248
-
249
-
250
-
251
-
252
-
253
-
254
-
255
-
256
-
257
-
258
-
259
-
260
-
261
-
262
-
263
-
264
-
265
-
266
-
267
-
268
-
269
-
270
 |
 |
108
3
GROUP MANAGEMENT REPORT – FINANCIAL REVIEW
Group Business Performance – Economic and Sector Development
European emerging markets recorded GDP growth of 0.8% in 2015, reflecting a slowdown from previous
years. The expansion was driven by modest export activity as well as wage growth resulting in firm consumer
spending. The deceleration from previous years was mainly the result of ongoing political unrest in Russia
and Ukraine as well as high inflationary pressures in these countries, which resulted in lower consumer
and investment spending. Russia’s economy was particularly negatively impacted by sanctions and high
inflationary pressures, which together with low oil prices and the continuing weakness of the rouble put
additional pressure on consumer sentiment and the overall state of the economy.
The US economy grew modestly in 2015, expanding 2.5%, driven by low inflationary pressures, improving
labour and housing market conditions as well as low oil prices that bolstered consumer spending. However,
lacklustre global growth, low energy prices and the continuing strength of the US dollar put pressure on
the industrial sector and export growth. The US Federal Reserve’s decision to increase interest rates
for the first time in nearly a decade in December reflects the improvements in the US economy and, in
particular, the labour market.
Asia remained the fastest-growing region with 3.8% GDP growth, although economic expansion slowed
compared to previous years. In China, growth slowed to 6.9%, due to lower industrial production, less activity
in the manufacturing sector as well as soft export growth and inhibited investment. Japan’s economy saw a
slight recovery with 0.6% growth, driven by an accommodative monetary policy, increases in real disposable
income, export growth as well as rising consumer and business sentiment. India’s economy expanded
by 7.3% in 2015, as low inflationary pressures and lower commodity prices fuelled consumer spending.
In Latin America, GDP remained stable versus the prior year with divergences across the region’s major
countries. Argentina’s economy recorded positive GDP growth, driven by improvements in the labour
market as well as increased government spending. In Brazil, low investment activity, weak consumer
confidence, political instability, unfavourable debt dynamics and rising unemployment drove further
economic contraction and deepened the country’s recession. Other regional economies such as Mexico,
Colombia and Chile posted healthy GDP increases in 2015, with increasing private consumer spending,
wage growth and stronger domestic demand fuelling expansion.
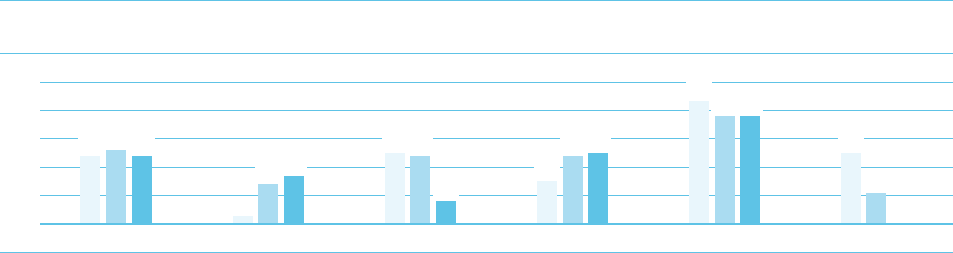
01REGIONALGDP DEVELOPMENT 1IN %
Global 2Western Europe 3European
emerging markets 3
USA 2Asia 3, 4 Latin America 3
5
4
3
2
1
0
■
2013
■
2014
■
2015
1 Real, percentage change versus prior year; 2013 and 2014 figures restated compared to prior year.
2 Source: World Bank.
3 Source: HSBC.
4 Includes Japan and Area Pacific.
2.6
0.3
2.4
2.5
0.8
2.4 2.5
1.5
3.8
4.3 3.8
2.5
1.1
0.0
1.4 1.7
2.4 2.4