Reebok 2015 Annual Report Download - page 116
Download and view the complete annual report
Please find page 116 of the 2015 Reebok annual report below. You can navigate through the pages in the report by either clicking on the pages listed below, or by using the keyword search tool below to find specific information within the annual report.-
 1
1 -
2
-
3
-
4
-
5
-
6
-
7
-
8
-
9
-
10
-
11
-
12
-
13
-
14
-
15
-
16
-
17
-
18
-
19
-
20
-
21
-
22
-
23
-
24
-
25
-
26
-
27
-
28
-
29
-
30
-
31
-
32
-
33
-
34
-
35
-
36
-
37
-
38
-
39
-
40
-
41
-
42
-
43
-
44
-
45
-
46
-
47
-
48
-
49
-
50
-
51
-
52
-
53
-
54
-
55
-
56
-
57
-
58
-
59
-
60
-
61
-
62
-
63
-
64
-
65
-
66
-
67
-
68
-
69
-
70
-
71
-
72
-
73
-
74
-
75
-
76
-
77
-
78
-
79
-
80
-
81
-
82
-
83
-
84
-
85
-
86
-
87
-
88
-
89
-
90
-
91
-
92
-
93
-
94
-
95
-
96
-
97
-
98
-
99
-
100
-
101
-
102
-
103
-
104
-
105
-
 106
106 -
 107
107 -
 108
108 -
 109
109 -
 110
110 -
 111
111 -
 112
112 -
 113
113 -
 114
114 -
 115
115 -
 116
116 -
 117
117 -
 118
118 -
 119
119 -
 120
120 -
 121
121 -
 122
122 -
 123
123 -
 124
124 -
 125
125 -
 126
126 -
127
-
128
-
129
-
130
-
131
-
132
-
133
-
134
-
135
-
136
-
137
-
138
-
139
-
140
-
141
-
142
-
143
-
144
-
145
-
146
-
147
-
148
-
149
-
150
-
151
-
152
-
153
-
154
-
155
-
156
-
157
-
158
-
159
-
160
-
161
-
162
-
163
-
164
-
165
-
166
-
167
-
168
-
169
-
170
-
171
-
172
-
173
-
174
-
175
-
176
-
177
-
178
-
179
-
180
-
181
-
182
-
183
-
184
-
185
-
186
-
187
-
188
-
189
-
190
-
191
-
192
-
193
-
194
-
195
-
196
-
197
-
198
-
199
-
200
-
201
-
202
-
203
-
204
-
205
-
206
-
207
-
208
-
209
-
210
-
211
-
212
-
213
-
214
-
215
-
216
-
217
-
218
-
219
-
220
-
221
-
222
-
223
-
224
-
225
-
226
-
227
-
228
-
229
-
230
-
231
-
232
-
233
-
234
-
235
-
236
-
237
-
238
-
239
-
240
-
241
-
242
-
243
-
244
-
245
-
246
-
247
-
248
-
249
-
250
-
251
-
252
-
253
-
254
-
255
-
256
-
257
-
258
-
259
-
260
-
261
-
262
-
263
-
264
-
265
-
266
-
267
-
268
-
269
-
270
 |
 |

112
3
GROUP MANAGEMENT REPORT – FINANCIAL REVIEW
Group Business Performance – Income Statement
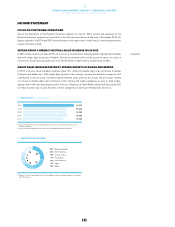
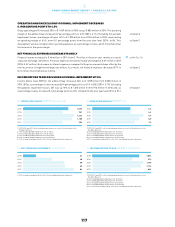
GROUP SALES UP IN FOOTWEAR ANDAPPAREL
In 2015, currency-neutral footwear sales grew 19%, mainly due to double-digit increases in the football
category as well as at adidas Originals and adidas neo. In addition, mid-single-digit growth in running
contributed to this development. Apparel revenues grew 5% on a currency-neutral basis. This development
was supported by double-digit growth at adidas Originals and adidas neo as well as high-single-digit growth
in the running category and mid-single-digit growth in the training category. Currency-neutral hardware
sales were down 8% compared to the prior year, as a result of declines at TaylorMade-adidas Golf.
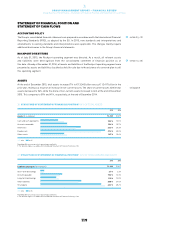
CURRENCY-NEUTRAL SALES GROW IN MOST MARKETSEGMENTS
In 2015, on a currency-neutral basis the combined sales of the adidas and Reebok brands grew in most
market segments. Revenues in Western Europe increased 17% on a currency-neutral basis, driven by
double-digit sales growth in the UK, Italy, France and Spain. Currency-neutral sales in North America
increased 5%. Revenues in Greater China grew 18% on a currency-neutral basis, while currency-neutral
sales in Russia/CIS declined 11%. In Latin America, revenues grew 12% on a currency-neutral basis, driven
by double-digit growth in Argentina, Mexico, Chile, Peru and Colombia. In Japan, sales remained stable on
a currency-neutral basis. Revenues in MEAA grew 14% on a currency-neutral basis, driven by double-digit
growth in South Korea, the United Arab Emirates, Turkey, Israel and Australia.
Revenues in Other Businesses were down 3% on a currency-neutral basis. High-single-digit sales increases
at Reebok-CCM Hockey and double-digit sales increases in Other centrally managed businesses were more
than offset by sales declines at TaylorMade-adidas Golf.
With the exception of Russia/CIS and Latin America, currency translation effects had a positive impact on
segmental sales in euro terms.
see Table 09
09NETSALES BY PRODUCTCATEGORY€ IN MILLIONS
2015 2014 Change Change
(currency-neutral)
Footwear 8,360 6,658 26% 19%
Apparel 6,970 6,279 11% 5%
Hardware 1,585 1,597 (1%) (8%)
Total 116,915 14,534 16% 10%
1 Rounding differences may arise in totals.
10NETSALES BY PRODUCTCATEGORY
49%
41%
9%
Footwear
Apparel
Hardware
49
41
9