Reebok 2015 Annual Report Download - page 3
Download and view the complete annual report
Please find page 3 of the 2015 Reebok annual report below. You can navigate through the pages in the report by either clicking on the pages listed below, or by using the keyword search tool below to find specific information within the annual report.-
 1
1 -
 2
2 -
 3
3 -
 4
4 -
 5
5 -
 6
6 -
 7
7 -
 8
8 -
 9
9 -
 10
10 -
 11
11 -
 12
12 -
 13
13 -
 14
14 -
15
-
16
-
17
-
18
-
19
-
20
-
21
-
22
-
23
-
24
-
25
-
26
-
27
-
28
-
29
-
30
-
31
-
32
-
33
-
34
-
35
-
36
-
37
-
38
-
39
-
40
-
41
-
42
-
43
-
44
-
45
-
46
-
47
-
48
-
49
-
50
-
51
-
52
-
53
-
54
-
55
-
56
-
57
-
58
-
59
-
60
-
61
-
62
-
63
-
64
-
65
-
66
-
67
-
68
-
69
-
70
-
71
-
72
-
73
-
74
-
75
-
76
-
77
-
78
-
79
-
80
-
81
-
82
-
83
-
84
-
85
-
86
-
87
-
88
-
89
-
90
-
91
-
92
-
93
-
94
-
95
-
96
-
97
-
98
-
99
-
100
-
101
-
102
-
103
-
104
-
105
-
106
-
107
-
108
-
109
-
110
-
111
-
112
-
113
-
114
-
115
-
116
-
117
-
118
-
119
-
120
-
121
-
122
-
123
-
124
-
125
-
126
-
127
-
128
-
129
-
130
-
131
-
132
-
133
-
134
-
135
-
136
-
137
-
138
-
139
-
140
-
141
-
142
-
143
-
144
-
145
-
146
-
147
-
148
-
149
-
150
-
151
-
152
-
153
-
154
-
155
-
156
-
157
-
158
-
159
-
160
-
161
-
162
-
163
-
164
-
165
-
166
-
167
-
168
-
169
-
170
-
171
-
172
-
173
-
174
-
175
-
176
-
177
-
178
-
179
-
180
-
181
-
182
-
183
-
184
-
185
-
186
-
187
-
188
-
189
-
190
-
191
-
192
-
193
-
194
-
195
-
196
-
197
-
198
-
199
-
200
-
201
-
202
-
203
-
204
-
205
-
206
-
207
-
208
-
209
-
210
-
211
-
212
-
213
-
214
-
215
-
216
-
217
-
218
-
219
-
220
-
221
-
222
-
223
-
224
-
225
-
226
-
227
-
228
-
229
-
230
-
231
-
232
-
233
-
234
-
235
-
236
-
237
-
238
-
239
-
240
-
241
-
242
-
243
-
244
-
245
-
246
-
247
-
248
-
249
-
250
-
251
-
252
-
253
-
254
-
255
-
256
-
257
-
258
-
259
-
260
-
261
-
262
-
263
-
264
-
265
-
266
-
267
-
268
-
269
-
270
 |
 |
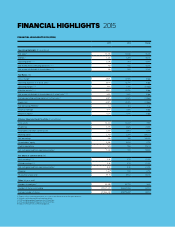
FINANCIAL HIGHLIGHTS 2015 IFRS
2015 2014 Change
Operating Highlights (€ in millions)
Net sales 116,915 14,534 16.4%
EBITDA 11,475 1,283 15.0%
Operating profit 1, 3, 4 1,094 961 13.8%
Net income from continuing operations 1, 3, 4 720 642 12.2%
Net income attributable to shareholders 2, 3, 4 668 568 17.6%
Key Ratios (%)
Gross margin 148.3% 47.6% 0.6pp
Operating expenses in % of net sales 143.1% 42.7% 0.4pp
Operating margin 1, 3, 4 6.5% 6.6% (0.1pp)
Effective tax rate 1, 3, 4 32.9% 29.7% 3.2pp
Net income attributable to shareholders in % of net sales 2, 3, 4 4.0% 3.9% 0.0pp
Average operating working capital in % of net sales 120.5% 22.4% (1.9pp)
Equity ratio 42.5% 45.3% (2.8pp)
Net borrowings/EBITDA 10.3 0.1 n.a.
Financial leverage 8.1% 3.3% 4.8pp
Return on equity 211.2% 8.7% 2.5pp
Balance Sheet and Cash Flow Data (€ in millions)
Total assets 13,343 12,417 7.5%
Inventories 3,113 2,526 23.2%
Receivables and other current assets 3,003 2,861 4.9%
Working capital 2,133 2,970 (28.2%)
Net borrowings 460 185 148.9%
Shareholders' equity 5,666 5,624 0.7%
Capital expenditure 513 554 (7.4%)
Net cash generated from operating activities 21,090 701 55.5%
Per Share of Common Stock (€)
Basic earnings 2, 3, 4 3.32 2.72 21.9%
Diluted earnings 2, 3, 4 3.32 2.72 21.9%
Net cash generated from operating activities 25.41 3.36 61.1%
Dividend 1.60 51.50 6.7%
Share price at year-end 89.91 57.62 56.0%
Other (at year-end)
Number of employees 155,555 53,731 3.4%
Number of shares outstanding 200,197,417 204,327,044 (2.0%)
Average number of shares 201,536,418 208,776,457 (3.5%)
1 Figures reflect continuing operations as a result of the divestiture of the Rockport business.
2 Includes continuing and discontinued operations.
3 2015 excluding goodwill impairment of € 34 million.
4 2014 excluding goodwill impairment of € 78 million.
5 Subject to Annual General Meeting approval.
FINANCIAL HIGHLIGHTS2015