Reebok 2015 Annual Report Download - page 157
Download and view the complete annual report
Please find page 157 of the 2015 Reebok annual report below. You can navigate through the pages in the report by either clicking on the pages listed below, or by using the keyword search tool below to find specific information within the annual report.-
 1
1 -
2
-
3
-
4
-
5
-
6
-
7
-
8
-
9
-
10
-
11
-
12
-
13
-
14
-
15
-
16
-
17
-
18
-
19
-
20
-
21
-
22
-
23
-
24
-
25
-
26
-
27
-
28
-
29
-
30
-
31
-
32
-
33
-
34
-
35
-
36
-
37
-
38
-
39
-
40
-
41
-
42
-
43
-
44
-
45
-
46
-
47
-
48
-
49
-
50
-
51
-
52
-
53
-
54
-
55
-
56
-
57
-
58
-
59
-
60
-
61
-
62
-
63
-
64
-
65
-
66
-
67
-
68
-
69
-
70
-
71
-
72
-
73
-
74
-
75
-
76
-
77
-
78
-
79
-
80
-
81
-
82
-
83
-
84
-
85
-
86
-
87
-
88
-
89
-
90
-
91
-
92
-
93
-
94
-
95
-
96
-
97
-
98
-
99
-
100
-
101
-
102
-
103
-
104
-
105
-
106
-
107
-
108
-
109
-
110
-
111
-
112
-
113
-
114
-
115
-
116
-
117
-
118
-
119
-
120
-
121
-
122
-
123
-
124
-
125
-
126
-
127
-
128
-
129
-
130
-
131
-
132
-
133
-
134
-
135
-
136
-
137
-
138
-
139
-
140
-
141
-
142
-
143
-
144
-
145
-
146
-
 147
147 -
 148
148 -
 149
149 -
 150
150 -
 151
151 -
 152
152 -
 153
153 -
 154
154 -
 155
155 -
 156
156 -
 157
157 -
 158
158 -
 159
159 -
 160
160 -
 161
161 -
 162
162 -
 163
163 -
 164
164 -
 165
165 -
 166
166 -
 167
167 -
168
-
169
-
170
-
171
-
172
-
173
-
174
-
175
-
176
-
177
-
178
-
179
-
180
-
181
-
182
-
183
-
184
-
185
-
186
-
187
-
188
-
189
-
190
-
191
-
192
-
193
-
194
-
195
-
196
-
197
-
198
-
199
-
200
-
201
-
202
-
203
-
204
-
205
-
206
-
207
-
208
-
209
-
210
-
211
-
212
-
213
-
214
-
215
-
216
-
217
-
218
-
219
-
220
-
221
-
222
-
223
-
224
-
225
-
226
-
227
-
228
-
229
-
230
-
231
-
232
-
233
-
234
-
235
-
236
-
237
-
238
-
239
-
240
-
241
-
242
-
243
-
244
-
245
-
246
-
247
-
248
-
249
-
250
-
251
-
252
-
253
-
254
-
255
-
256
-
257
-
258
-
259
-
260
-
261
-
262
-
263
-
264
-
265
-
266
-
267
-
268
-
269
-
270
 |
 |
GROUP MANAGEMENT REPORT – FINANCIAL REVIEW
Subsequent Events and Outlook
153
3
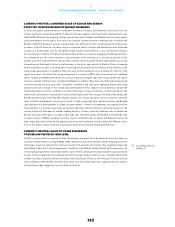
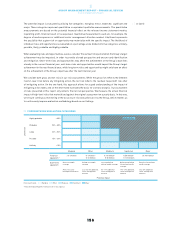
CURRENCY-NEUTRAL RETAIL REVENUESTO INCREASE
ATA DOUBLE-DIGIT RATE
adidas Group currency-neutral retail sales are projected to grow at a double-digit rate in 2016. This
development will be driven by significant increases in eCommerce, the further expansion of the Group’s
own-retail activities as well as comparable store sales growth. We plan to open around 250 new stores in
2016, depending on the availability of desired locations. As approximately 150 stores will be closed over
the course of the year, the Group expects a net increase of its store base of around 100 adidas and Reebok
stores. Around 250 stores will be remodelled.
GROUP GROSS MARGIN EXPECTEDTO BE IN A RANGE BETWEEN 47.3% AND 47.8%
In 2016, the adidas Group gross margin is forecasted to be in a range between 47.3% and 47.8% and thus
between 50 and 100 basis points below the prior year level (2015: 48.3%). The decline reflects the projected
increase in costs for the Group’s Asian-dominated sourcing as a result of less favourable US dollar hedging
rates and rising labour expenditures. However, these negative effects are projected to be largely offset by
the positive effects from a more favourable pricing, product and regional mix at both adidas and Reebok
and further enhancements in the Group’s channel mix, driven by the continued expansion of our controlled
space activities. Higher product margins at TaylorMade-adidas Golf are also expected to help limit the
overall gross margin compression.
GROUP OTHER OPERATING EXPENSESTO DECREASE ASA PERCENTAGE OF SALES
In 2016, the Group’s other operating expenses as a percentage of sales are expected to decrease compared
to the prior year level of 43.1%. Expenditure for point-of-sale and marketing investments as a percentage
of sales is projected to be around the prior year level (2015: 13.9%). Given the strong momentum at adidas
and Reebok, we will continue to invest over-proportionately in both brands to further drive brand desirability
and generate sustainable market share gains as well as strong top- and bottom-line growth. In addition,
expenditure for marketing investments will be focused around major sporting events such as the UEFA
EURO 2016 to leverage the strong visibility of the adidas brand during the event as well as on innovative
product launches and engaging grassroots events. In addition, we will support Reebok’s growth strategy
in key fitness categories, leveraging partnership assets such as CrossFit, Spartan Race and the UFC, while
at the same time strengthening Reebok’s controlled space initiatives. Operating overhead expenditure as a
percentage of sales is forecasted to be below the prior year level (2015: 29.2%). Higher administrative and
personnel expenses in the Group’s sales and marketing organisation, aimed at supporting the successful
execution of ‘Creating the New’, will be offset by significant leverage in other areas.
OPERATING MARGIN EXCLUDING GOODWILL IMPAIRMENT
TO REMAIN AT LEASTSTABLE COMPAREDTOTHE PRIOR YEAR LEVEL
In 2016, we expect the operating margin excluding goodwill impairment for the adidas Group to remain at
least stable compared to the prior year level of 6.5%. Lower other operating expenses as a percentage of
sales are forecasted to at least offset the decline in gross margin.
NET INCOME FROM CONTINUING OPERATIONS EXCLUDING GOODWILL
IMPAIRMENT TO INCREASE ATA RATE BETWEEN 10% AND 12%
Net income from continuing operations excluding goodwill impairment is projected to increase at a rate
between 10% and 12% to a level of around € 800 million compared to net income from continuing operations
excluding goodwill impairment losses of € 720 million in 2015. Net financial expenses are forecasted to
increase in 2016, as a result of the non-recurrence of positive exchange rate effects. The Group’s tax rate
is projected to be at a level of around 30% and thus below the prior year level (2015: tax rate excluding
goodwill impairment losses of 32.9%).