Reebok 2015 Annual Report Download - page 177
Download and view the complete annual report
Please find page 177 of the 2015 Reebok annual report below. You can navigate through the pages in the report by either clicking on the pages listed below, or by using the keyword search tool below to find specific information within the annual report.-
 1
1 -
2
-
3
-
4
-
5
-
6
-
7
-
8
-
9
-
10
-
11
-
12
-
13
-
14
-
15
-
16
-
17
-
18
-
19
-
20
-
21
-
22
-
23
-
24
-
25
-
26
-
27
-
28
-
29
-
30
-
31
-
32
-
33
-
34
-
35
-
36
-
37
-
38
-
39
-
40
-
41
-
42
-
43
-
44
-
45
-
46
-
47
-
48
-
49
-
50
-
51
-
52
-
53
-
54
-
55
-
56
-
57
-
58
-
59
-
60
-
61
-
62
-
63
-
64
-
65
-
66
-
67
-
68
-
69
-
70
-
71
-
72
-
73
-
74
-
75
-
76
-
77
-
78
-
79
-
80
-
81
-
82
-
83
-
84
-
85
-
86
-
87
-
88
-
89
-
90
-
91
-
92
-
93
-
94
-
95
-
96
-
97
-
98
-
99
-
100
-
101
-
102
-
103
-
104
-
105
-
106
-
107
-
108
-
109
-
110
-
111
-
112
-
113
-
114
-
115
-
116
-
117
-
118
-
119
-
120
-
121
-
122
-
123
-
124
-
125
-
126
-
127
-
128
-
129
-
130
-
131
-
132
-
133
-
134
-
135
-
136
-
137
-
138
-
139
-
140
-
141
-
142
-
143
-
144
-
145
-
146
-
147
-
148
-
149
-
150
-
151
-
152
-
153
-
154
-
155
-
156
-
157
-
158
-
159
-
160
-
161
-
162
-
163
-
164
-
165
-
166
-
 167
167 -
 168
168 -
 169
169 -
 170
170 -
 171
171 -
 172
172 -
 173
173 -
 174
174 -
 175
175 -
 176
176 -
 177
177 -
 178
178 -
 179
179 -
 180
180 -
 181
181 -
 182
182 -
 183
183 -
 184
184 -
 185
185 -
 186
186 -
 187
187 -
188
-
189
-
190
-
191
-
192
-
193
-
194
-
195
-
196
-
197
-
198
-
199
-
200
-
201
-
202
-
203
-
204
-
205
-
206
-
207
-
208
-
209
-
210
-
211
-
212
-
213
-
214
-
215
-
216
-
217
-
218
-
219
-
220
-
221
-
222
-
223
-
224
-
225
-
226
-
227
-
228
-
229
-
230
-
231
-
232
-
233
-
234
-
235
-
236
-
237
-
238
-
239
-
240
-
241
-
242
-
243
-
244
-
245
-
246
-
247
-
248
-
249
-
250
-
251
-
252
-
253
-
254
-
255
-
256
-
257
-
258
-
259
-
260
-
261
-
262
-
263
-
264
-
265
-
266
-
267
-
268
-
269
-
270
 |
 |

173
3
GROUP MANAGEMENT REPORT – FINANCIAL REVIEW
Risk and Opportunity Report – Illustration of Opportunities
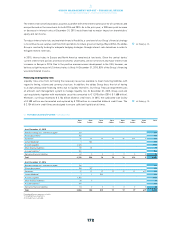
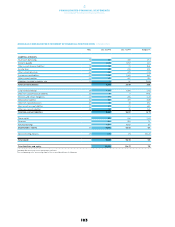
Future cash outflows arising from financial liabilities that are recognised in the Consolidated Statement of
Financial Position are presented in the table. This includes payments to settle obligations from borrowings
as well as cash outflows from cash-settled derivatives with negative market values. Financial liabilities
that may be settled in advance without penalty are included on the basis of the earliest date of potential
repayment. Cash flows for variable-interest liabilities are determined with reference to the conditions at
the balance sheet date.
We ended the year 2015 with net debt of € 460 million (2014: € 185 million). Thus, the ratio of net borrowings
over EBITDA was 0.3 times at year-end, which is in line with the Group’s medium-term guideline of less
than two times.
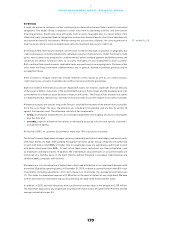
ILLUSTRATION OF OPPORTUNITIES
In this report, we only illustrate opportunities we deem to be relevant for the Group in 2016. In addition,
the Group has already identified various other opportunities which could have a mid- to long-term positive
impact for the Group’s top- and bottom-line performance but are not described in detail in this report. The
assessment of all opportunities is shown in the opportunities overview table.
STRATEGICAND OPERATIONALOPPORTUNITIES
Organic growth opportunities
Controlled space: The sporting goods retail environment is changing constantly. We therefore continue
to adapt our distribution strategy to the constantly changing sporting goods retail environment and have
made controlled space initiatives a strategic priority. This includes retail space management with key
retail partners, the introduction of new own-retail store formats as well as the further expansion of our
e-commerce activities. We also continue to expand our direct-to-consumer activities in emerging markets
such as South East Asia, the Middle East and North Africa. Successful results from these initiatives could
enable us to accelerate top- and bottom-line growth.
Marketing activation/promotion partnerships: Well-executed campaigns and marketing initiatives could
increase brand desire and consumer appeal, which may drive full-price sell-through and result in higher-
than-expected sales and profit. In addition, outstanding competitive performance of promotion partners
such as individual athletes, club teams or national teams may further increase their popularity amongst
consumers. As a result, the Group may generate higher sales of signature footwear or licensed apparel
and accessories.
see Table 07
see Table 08
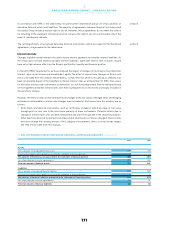
08CORPORATE OPPORTUNITIES OVERVIEW
Potential
impact
Change
(2014 rating)
Likelihood Change
(2014 rating)
Strategic and operational opportunities
Organic growth opportunities Moderate (Major) Possible (Unlikely)
Opportunities related to organisational and process
improvements
Moderate (Major) Possible
Personnel opportunities Moderate Possible
Macroeconomic, sociopolitical and regulatory
opportunities
Minor (Moderate) Likely (Possible)
Financial opportunities
Favourable financial market changes Major Possible