Reebok 2015 Annual Report Download - page 199
Download and view the complete annual report
Please find page 199 of the 2015 Reebok annual report below. You can navigate through the pages in the report by either clicking on the pages listed below, or by using the keyword search tool below to find specific information within the annual report.-
 1
1 -
2
-
3
-
4
-
5
-
6
-
7
-
8
-
9
-
10
-
11
-
12
-
13
-
14
-
15
-
16
-
17
-
18
-
19
-
20
-
21
-
22
-
23
-
24
-
25
-
26
-
27
-
28
-
29
-
30
-
31
-
32
-
33
-
34
-
35
-
36
-
37
-
38
-
39
-
40
-
41
-
42
-
43
-
44
-
45
-
46
-
47
-
48
-
49
-
50
-
51
-
52
-
53
-
54
-
55
-
56
-
57
-
58
-
59
-
60
-
61
-
62
-
63
-
64
-
65
-
66
-
67
-
68
-
69
-
70
-
71
-
72
-
73
-
74
-
75
-
76
-
77
-
78
-
79
-
80
-
81
-
82
-
83
-
84
-
85
-
86
-
87
-
88
-
89
-
90
-
91
-
92
-
93
-
94
-
95
-
96
-
97
-
98
-
99
-
100
-
101
-
102
-
103
-
104
-
105
-
106
-
107
-
108
-
109
-
110
-
111
-
112
-
113
-
114
-
115
-
116
-
117
-
118
-
119
-
120
-
121
-
122
-
123
-
124
-
125
-
126
-
127
-
128
-
129
-
130
-
131
-
132
-
133
-
134
-
135
-
136
-
137
-
138
-
139
-
140
-
141
-
142
-
143
-
144
-
145
-
146
-
147
-
148
-
149
-
150
-
151
-
152
-
153
-
154
-
155
-
156
-
157
-
158
-
159
-
160
-
161
-
162
-
163
-
164
-
165
-
166
-
167
-
168
-
169
-
170
-
171
-
172
-
173
-
174
-
175
-
176
-
177
-
178
-
179
-
180
-
181
-
182
-
183
-
184
-
185
-
186
-
187
-
188
-
 189
189 -
 190
190 -
 191
191 -
 192
192 -
 193
193 -
 194
194 -
 195
195 -
 196
196 -
 197
197 -
 198
198 -
 199
199 -
 200
200 -
 201
201 -
 202
202 -
 203
203 -
 204
204 -
 205
205 -
 206
206 -
 207
207 -
 208
208 -
 209
209 -
210
-
211
-
212
-
213
-
214
-
215
-
216
-
217
-
218
-
219
-
220
-
221
-
222
-
223
-
224
-
225
-
226
-
227
-
228
-
229
-
230
-
231
-
232
-
233
-
234
-
235
-
236
-
237
-
238
-
239
-
240
-
241
-
242
-
243
-
244
-
245
-
246
-
247
-
248
-
249
-
250
-
251
-
252
-
253
-
254
-
255
-
256
-
257
-
258
-
259
-
260
-
261
-
262
-
263
-
264
-
265
-
266
-
267
-
268
-
269
-
270
 |
 |

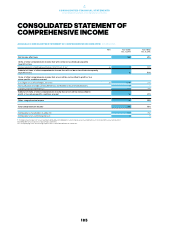
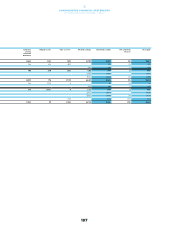
CONSOLIDATED FINANCIAL STATEMENTS
Notes
195
4
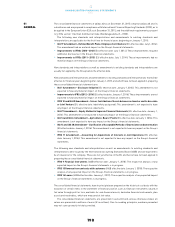
Property, plant and equipment
Property, plant and equipment are measured at amortised cost. This comprises any costs directly
attributable to bringing the asset to the condition necessary for it to be capable of operating in the manner
intended by Management less accumulated depreciation (except for land and construction in progress)
and accumulated impairment losses. Depreciation is recognised over the estimated useful life utilising the
‘straight-line method’ and taking into account any potential residual value, except where the ‘declining-
balance method’ is more appropriate in light of the actual utilisation pattern. Parts of an item of property,
plant and equipment with a cost that is significant in relation to the total cost of the item are depreciated
separately.
Land leases are measured at the lower of the fair value or the present value of minimum lease payments
and are depreciated on a straight-line basis over the contractually agreed lease term.
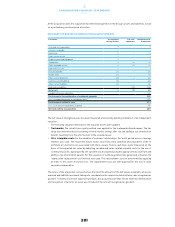
Estimated useful lives are as follows:
ESTIMATED USEFUL LIVES OF PROPERTY, PLANTAND EQUIPMENT
Years
Land indefinite
Land leases 99
Buildings and leasehold improvements 20 – 50 1
Technical equipment and machinery as well as other equipment and furniture and fixtures 2 – 10
1 Or, if shorter, the lease term/useful life (see Note 28).
Expenditures for repairs and maintenance are expensed as incurred. Renewals and improvements are
capitalised and depreciated separately, if the recognition criteria are met.
Impairment losses
If facts and circumstances indicate that non-current assets (e.g. property, plant and equipment, intangible
assets including goodwill and certain financial assets) might be impaired, the recoverable amount is
determined. It is measured at the higher of its fair value less costs to sell and value in use. Non-financial
instruments measured at the recoverable amount primarily relate to impaired property, plant and equipment
being measured at Level 3 according to IFRS 13 ‘Fair Value Measurement’ and taking unobservable inputs
(e.g. profit or cash flow planning) into account.
An impairment loss is recognised in other operating expenses or reported in goodwill impairment losses
if the carrying amount exceeds the recoverable amount.
The impairment test for goodwill is performed based on cash-generating units which represent the
lowest level within the Group at which goodwill is monitored for internal management purposes. If there
is an impairment loss for a cash-generating unit, first the carrying amount of any goodwill allocated to the
cash-generating unit is reduced. Subsequently, provided that the recoverable amount is lower than the
carrying amount, the other non-current assets of the unit are reduced pro rata on the basis of the carrying
amount of each asset in the unit.
Irrespective of whether there is an impairment indication, intangible assets with an indefinite useful
life (in particular trademarks) and goodwill acquired in business combinations are tested annually for
impairment.
An impairment loss recognised in goodwill is not reversible. With respect to all other impaired assets,
an impairment loss recognised in prior periods is reversed affecting the income statement if there has been
a change in the estimates used to determine the recoverable amount. An impairment loss is reversed only
to the extent that the asset’s carrying amount does not exceed the carrying amount that would have been
determined (net of depreciation or amortisation) if no impairment loss had been recognised.