Reebok 2015 Annual Report Download - page 82
Download and view the complete annual report
Please find page 82 of the 2015 Reebok annual report below. You can navigate through the pages in the report by either clicking on the pages listed below, or by using the keyword search tool below to find specific information within the annual report.-
 1
1 -
2
-
3
-
4
-
5
-
6
-
7
-
8
-
9
-
10
-
11
-
12
-
13
-
14
-
15
-
16
-
17
-
18
-
19
-
20
-
21
-
22
-
23
-
24
-
25
-
26
-
27
-
28
-
29
-
30
-
31
-
32
-
33
-
34
-
35
-
36
-
37
-
38
-
39
-
40
-
41
-
42
-
43
-
44
-
45
-
46
-
47
-
48
-
49
-
50
-
51
-
52
-
53
-
54
-
55
-
56
-
57
-
58
-
59
-
60
-
61
-
62
-
63
-
64
-
65
-
66
-
67
-
68
-
69
-
70
-
71
-
 72
72 -
 73
73 -
 74
74 -
 75
75 -
 76
76 -
 77
77 -
 78
78 -
 79
79 -
 80
80 -
 81
81 -
 82
82 -
 83
83 -
 84
84 -
 85
85 -
 86
86 -
 87
87 -
 88
88 -
 89
89 -
 90
90 -
 91
91 -
 92
92 -
93
-
94
-
95
-
96
-
97
-
98
-
99
-
100
-
101
-
102
-
103
-
104
-
105
-
106
-
107
-
108
-
109
-
110
-
111
-
112
-
113
-
114
-
115
-
116
-
117
-
118
-
119
-
120
-
121
-
122
-
123
-
124
-
125
-
126
-
127
-
128
-
129
-
130
-
131
-
132
-
133
-
134
-
135
-
136
-
137
-
138
-
139
-
140
-
141
-
142
-
143
-
144
-
145
-
146
-
147
-
148
-
149
-
150
-
151
-
152
-
153
-
154
-
155
-
156
-
157
-
158
-
159
-
160
-
161
-
162
-
163
-
164
-
165
-
166
-
167
-
168
-
169
-
170
-
171
-
172
-
173
-
174
-
175
-
176
-
177
-
178
-
179
-
180
-
181
-
182
-
183
-
184
-
185
-
186
-
187
-
188
-
189
-
190
-
191
-
192
-
193
-
194
-
195
-
196
-
197
-
198
-
199
-
200
-
201
-
202
-
203
-
204
-
205
-
206
-
207
-
208
-
209
-
210
-
211
-
212
-
213
-
214
-
215
-
216
-
217
-
218
-
219
-
220
-
221
-
222
-
223
-
224
-
225
-
226
-
227
-
228
-
229
-
230
-
231
-
232
-
233
-
234
-
235
-
236
-
237
-
238
-
239
-
240
-
241
-
242
-
243
-
244
-
245
-
246
-
247
-
248
-
249
-
250
-
251
-
252
-
253
-
254
-
255
-
256
-
257
-
258
-
259
-
260
-
261
-
262
-
263
-
264
-
265
-
266
-
267
-
268
-
269
-
270
 |
 |
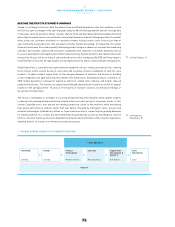
GROUP MANAGEMENT REPORT – OUR GROUP
Global Operations
78
2
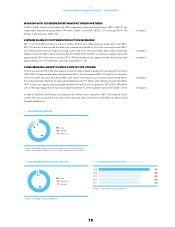
WORKINGWITH 320 INDEPENDENT MANUFACTURING PARTNERS
In 2015, Global Operations worked with 320 independent manufacturing partners (2014: 340). Of our
independent manufacturing partners, 79% were located in Asia (2014: 83%), 12% in Europe (2014: 7%)
and 9% in the Americas (2014: 9%).
VIETNAM SHARE OF FOOTWEAR PRODUCTION INCREASES
96% of our total 2015 footwear volume for adidas, Reebok and adidas Golf was produced in Asia (2014:
96%). Production in Europe and the Americas combined accounted for 4% of the sourcing volume (2014:
4%). Vietnam represents our largest sourcing country with 41% of the total volume (2014: 39%), followed by
Indonesia with 24% (2014: 23%) and China with 23% (2014: 27%). In 2015, our footwear suppliers produced
approximately 301 million pairs of shoes (2014: 258 million pairs). Our largest footwear factory produced
approximately 11% of the footwear sourcing volume (2014: 11%).
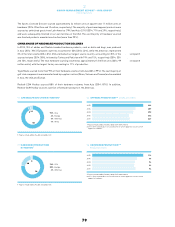
CHINA REMAINS LARGESTSOURCE COUNTRY FOR APPAREL
In 2015, we sourced 93% of the total apparel volume for adidas, Reebok, adidas Golf and Ashworth from Asia
(2014: 93%). Europe and the Americas represented 3% of the volume each (2014: 5% and 2%, respectively).
1% of the volume was sourced in Africa (2014: 0%). China is the largest source country, representing 29% of
the produced volume (2014: 31%), followed by Cambodia with 19% (2014: 16%) and Vietnam with 16% (2014:
13%). In total, our suppliers produced approximately 364 million units of apparel in 2015 (2014: 309 million
units). The largest apparel factory produced approximately 11% of this apparel volume in 2015 (2014: 11%).
In addition, Reebok-CCM Hockey sourced around 3 million units of apparel in 2015. The majority of this
volume was also produced in Asia, while small portions were sourced from the Americas (particularly
Canada) and Europe.
see Diagram 02
see Diagram 03
see Diagram 04
see Diagram 05
see Diagram 06
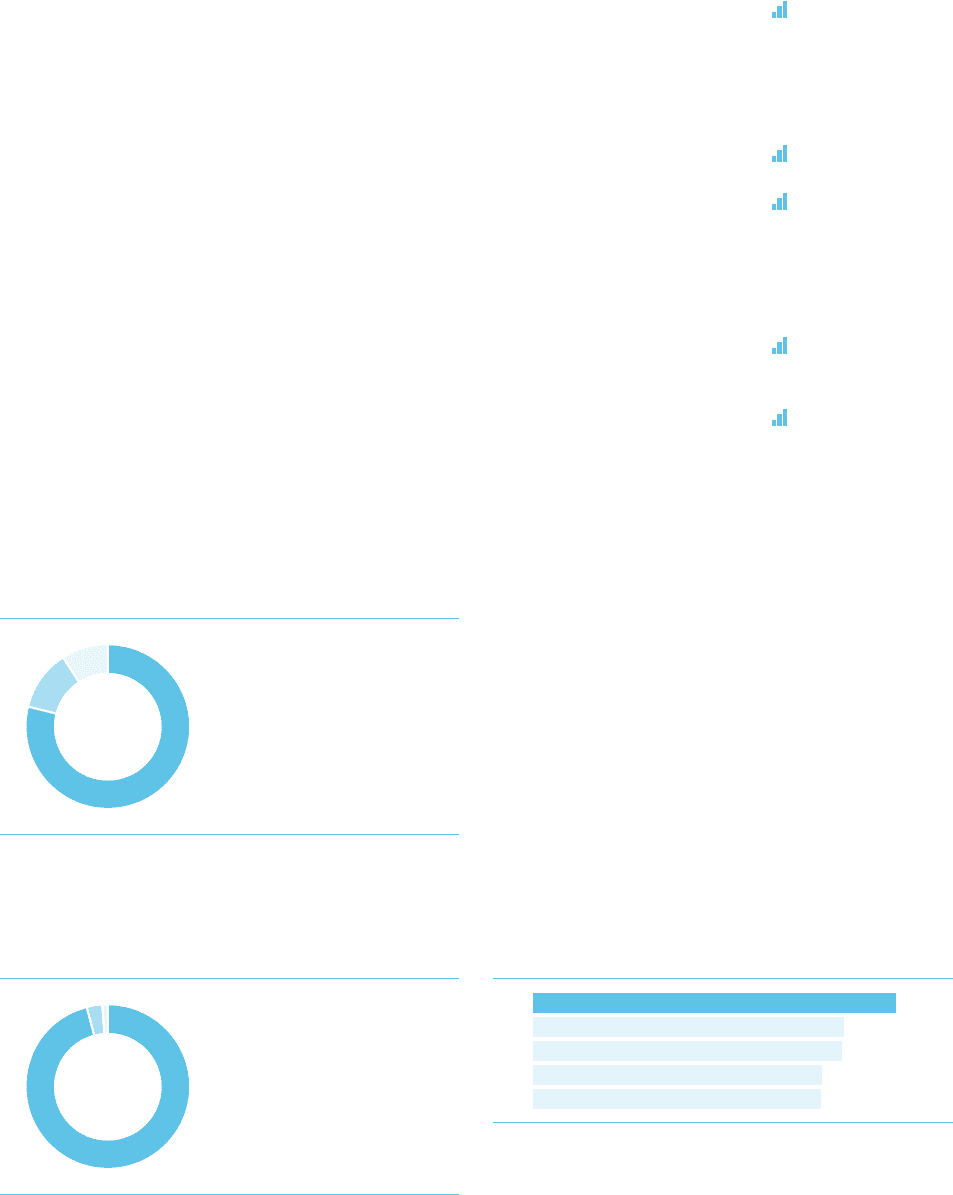
02SUPPLIERS BY REGION 1
79%
12%
9%
Asia
Europe
Americas
1 Figures include adidas, Reebok, adidas Golf and Ashworth, but exclude local sourcing
partners, sourcing agents, subcontractors, second-tier suppliers and licensee factories.
79
12
9
03FOOTWEAR PRODUCTION BY REGION 1
96%
3%
1%
Asia
Americas
Europe
1 Figures include adidas, Reebok and adidas Golf.
04FOOTWEAR PRODUCTION 1IN MILLION PAIRS
2015 301
2014 258
2013 256
2012 240
2011 239
1 Figures include adidas, Reebok and adidas Golf.
96
1
3