Reebok 2015 Annual Report Download - page 180
Download and view the complete annual report
Please find page 180 of the 2015 Reebok annual report below. You can navigate through the pages in the report by either clicking on the pages listed below, or by using the keyword search tool below to find specific information within the annual report.-
 1
1 -
2
-
3
-
4
-
5
-
6
-
7
-
8
-
9
-
10
-
11
-
12
-
13
-
14
-
15
-
16
-
17
-
18
-
19
-
20
-
21
-
22
-
23
-
24
-
25
-
26
-
27
-
28
-
29
-
30
-
31
-
32
-
33
-
34
-
35
-
36
-
37
-
38
-
39
-
40
-
41
-
42
-
43
-
44
-
45
-
46
-
47
-
48
-
49
-
50
-
51
-
52
-
53
-
54
-
55
-
56
-
57
-
58
-
59
-
60
-
61
-
62
-
63
-
64
-
65
-
66
-
67
-
68
-
69
-
70
-
71
-
72
-
73
-
74
-
75
-
76
-
77
-
78
-
79
-
80
-
81
-
82
-
83
-
84
-
85
-
86
-
87
-
88
-
89
-
90
-
91
-
92
-
93
-
94
-
95
-
96
-
97
-
98
-
99
-
100
-
101
-
102
-
103
-
104
-
105
-
106
-
107
-
108
-
109
-
110
-
111
-
112
-
113
-
114
-
115
-
116
-
117
-
118
-
119
-
120
-
121
-
122
-
123
-
124
-
125
-
126
-
127
-
128
-
129
-
130
-
131
-
132
-
133
-
134
-
135
-
136
-
137
-
138
-
139
-
140
-
141
-
142
-
143
-
144
-
145
-
146
-
147
-
148
-
149
-
150
-
151
-
152
-
153
-
154
-
155
-
156
-
157
-
158
-
159
-
160
-
161
-
162
-
163
-
164
-
165
-
166
-
167
-
168
-
169
-
 170
170 -
 171
171 -
 172
172 -
 173
173 -
 174
174 -
 175
175 -
 176
176 -
 177
177 -
 178
178 -
 179
179 -
 180
180 -
 181
181 -
 182
182 -
 183
183 -
 184
184 -
 185
185 -
 186
186 -
 187
187 -
 188
188 -
 189
189 -
 190
190 -
191
-
192
-
193
-
194
-
195
-
196
-
197
-
198
-
199
-
200
-
201
-
202
-
203
-
204
-
205
-
206
-
207
-
208
-
209
-
210
-
211
-
212
-
213
-
214
-
215
-
216
-
217
-
218
-
219
-
220
-
221
-
222
-
223
-
224
-
225
-
226
-
227
-
228
-
229
-
230
-
231
-
232
-
233
-
234
-
235
-
236
-
237
-
238
-
239
-
240
-
241
-
242
-
243
-
244
-
245
-
246
-
247
-
248
-
249
-
250
-
251
-
252
-
253
-
254
-
255
-
256
-
257
-
258
-
259
-
260
-
261
-
262
-
263
-
264
-
265
-
266
-
267
-
268
-
269
-
270
 |
 |

GROUP MANAGEMENT REPORT – FINANCIAL REVIEW
Management Assessment of Performance, Risks and Opportunities, and Outlook
176
3
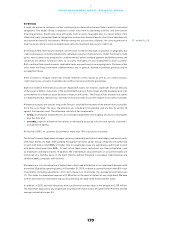
Beyond our financial performance, we also actively monitor the Group’s key non-financial KPIs on a regular
basis, as available. From a market share perspective, we continue to be very encouraged by our strong
performance in key emerging markets. In particular, Greater China, Latin America and South Korea were
notable standouts, as we further improved our market share in these markets in 2015. In Western Europe,
we saw momentum accelerate considerably in 2015, following significant changes to our organisational
set-up, which we implemented in the region. In North America, a region where we have underperformed in
previous years, we see momentum accelerating, driven by highly engaging consumer activation initiatives.
In the golf market, structural challenges continue to weigh on the sales development of TaylorMade-adidas
Golf, despite an overall cleaner trading environment. Nevertheless, we continue to enjoy healthy market
share positions in key categories such as metalwoods and irons, with market shares above 30% and around
20%, respectively. In light of ongoing structural, commercial and operational issues TaylorMade-adidas
Golf experienced in 2014 and 2015, which resulted in declines in net sales and profitability, we initiated
a major restructuring programme in 2015, with the main objective to significantly improve TaylorMade-
adidas Golf’s profitability going forward. In addition to the restructuring programme, we have engaged
with an investment bank for the purpose of analysing future options for our golf business, in particular
the Adams and Ashworth brands.
We continued to maintain a very strong level of on-time in-full (OTIF) deliveries to our customers and
own-retail stores in 2015. As in prior years, the majority of our sales in 2015 were again generated from
products launched in the past 12 to 18 months. In addition, we received several awards and industry
recognitions for our new product innovations. Finally, our diligence and discipline in sustainability matters
continues to yield strong recognition for our Group. In 2015, we were again represented in a variety of
high-profile sustainability indices. For the 16th consecutive time, we were selected to join the Dow Jones
Sustainability Indices (DJSI). In the sector ‘Textiles, Apparel & Luxury Goods’, we scored industry-best
ratings in the category Innovation Management and received far above-average scores in Supply Chain
Management, Stakeholder Engagement, Environmental Management System, and Talent Attraction and
Retention. Furthermore, in 2015, we were ranked third among the Global 100 Most Sustainable Corporations
in the World (Global 100 Index), recognised as best European company and as leader in our industry.
see Internal Group
Management System, p. 102
see TaylorMade-adidas Golf
Strategy, p. 69
see Global Operations, p. 74
see Research and
Development, p. 80
see Sustainability, p. 94
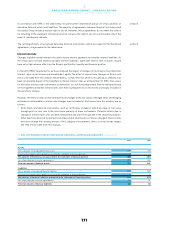
01ADIDAS GROUP TARGETSVERSUSACTUAL KEY METRICS
2014
Results 1
2015
Targets 1
2015
Results
2016
Outlook
Sales (year-over-year change, currency-neutral) 6% mid-single-digit increase 10% to increase at a rate
between 10% and 12%
Gross margin 47.6% 47.5% to 48.5% 48.3% 47.3% to 47.8%
Other operating expenses (in % of net sales) 42.7% around prior year level 43.1% below prior year level
Operating margin 6.6% 2between 6.5% and 7.0% 6.5% 3remain at least stable
versus prior year level
Net income from continuing operations (€ in million) 642 2increase at a rate
of 7% to 10%
720 3to increase at a rate
between 10% and 12% to
around € 800 million
Average operating working capital (in % of net sales) 22.4% moderate decline 20.5% around prior year level
Capital expenditure (€ in millions) 5554 4around 600 513 around 750
Gross borrowings (€ in millions) 1,873 moderate decline 1,830 moderate decline
1 As published on March 5, 2015. The outlook was updated over the course of the year.
2 Excluding goodwill impairment of € 78 million.
3 Excluding goodwill impairment of € 34 million.
4 Includes continuing and discontinued operations.
5 Excluding acquisitions and finance leases.