Reebok 2015 Annual Report Download - page 108
Download and view the complete annual report
Please find page 108 of the 2015 Reebok annual report below. You can navigate through the pages in the report by either clicking on the pages listed below, or by using the keyword search tool below to find specific information within the annual report.-
 1
1 -
2
-
3
-
4
-
5
-
6
-
7
-
8
-
9
-
10
-
11
-
12
-
13
-
14
-
15
-
16
-
17
-
18
-
19
-
20
-
21
-
22
-
23
-
24
-
25
-
26
-
27
-
28
-
29
-
30
-
31
-
32
-
33
-
34
-
35
-
36
-
37
-
38
-
39
-
40
-
41
-
42
-
43
-
44
-
45
-
46
-
47
-
48
-
49
-
50
-
51
-
52
-
53
-
54
-
55
-
56
-
57
-
58
-
59
-
60
-
61
-
62
-
63
-
64
-
65
-
66
-
67
-
68
-
69
-
70
-
71
-
72
-
73
-
74
-
75
-
76
-
77
-
78
-
79
-
80
-
81
-
82
-
83
-
84
-
85
-
86
-
87
-
88
-
89
-
90
-
91
-
92
-
93
-
94
-
95
-
96
-
97
-
 98
98 -
 99
99 -
 100
100 -
 101
101 -
 102
102 -
 103
103 -
 104
104 -
 105
105 -
 106
106 -
 107
107 -
 108
108 -
 109
109 -
 110
110 -
 111
111 -
 112
112 -
 113
113 -
 114
114 -
 115
115 -
 116
116 -
 117
117 -
 118
118 -
119
-
120
-
121
-
122
-
123
-
124
-
125
-
126
-
127
-
128
-
129
-
130
-
131
-
132
-
133
-
134
-
135
-
136
-
137
-
138
-
139
-
140
-
141
-
142
-
143
-
144
-
145
-
146
-
147
-
148
-
149
-
150
-
151
-
152
-
153
-
154
-
155
-
156
-
157
-
158
-
159
-
160
-
161
-
162
-
163
-
164
-
165
-
166
-
167
-
168
-
169
-
170
-
171
-
172
-
173
-
174
-
175
-
176
-
177
-
178
-
179
-
180
-
181
-
182
-
183
-
184
-
185
-
186
-
187
-
188
-
189
-
190
-
191
-
192
-
193
-
194
-
195
-
196
-
197
-
198
-
199
-
200
-
201
-
202
-
203
-
204
-
205
-
206
-
207
-
208
-
209
-
210
-
211
-
212
-
213
-
214
-
215
-
216
-
217
-
218
-
219
-
220
-
221
-
222
-
223
-
224
-
225
-
226
-
227
-
228
-
229
-
230
-
231
-
232
-
233
-
234
-
235
-
236
-
237
-
238
-
239
-
240
-
241
-
242
-
243
-
244
-
245
-
246
-
247
-
248
-
249
-
250
-
251
-
252
-
253
-
254
-
255
-
256
-
257
-
258
-
259
-
260
-
261
-
262
-
263
-
264
-
265
-
266
-
267
-
268
-
269
-
270
 |
 |

GROUP MANAGEMENT REPORT – FINANCIAL REVIEW
Internal Group Management System
104
3
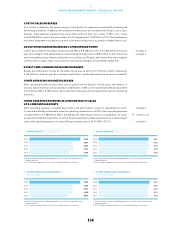
CAPITAL EXPENDITURE TARGETEDTO MAXIMISE FUTURE RETURNS
Improving the effectiveness of the Group’s capital expenditure is another lever to maximise our operating
cash flow. We control capital expenditure with a top-down, bottom-up approach. In a first step, Group
Management defines focus areas and an overall investment budget based on investment requests from
various functions within the organisation. Our operating segments then align their initiatives within the
scope of assigned priorities and available budget. We evaluate potential return on planned investments
utilising the net present value method. Risk is accounted for, adding a risk premium to the cost of capital
and thus reducing our estimated future earnings streams where appropriate. By means of scenario
planning, the sensitivity of investment returns is tested against changes in initial assumptions. For large
investment projects, timelines and deviations versus budget are monitored on a monthly basis throughout
the course of the project.
The final step of optimising return on investments is our selective post-mortem reviews, where larger
projects in particular are evaluated and learnings are documented to be available for future capital
expenditure decisions.
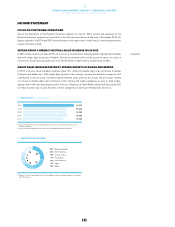
NON-FINANCIAL KEY PERFORMANCE INDICATORS
In addition to the Group’s major financial KPIs to assess the performance and operational success of
the adidas Group, as outlined above, we have identified a set of non-financial KPIs that help us track our
progress in areas that are critical for our long-term success but are, however, not directly reflected in the
Group’s financial statements. These non-financial KPIs are assessed on a regular basis and managed by
the respective Group functions. Non-financial KPIs include market share and Net Promoter Score, our
customer delivery performance (On-Time In-Full), our employee engagement and a set of KPIs in the area
of our sustainability performance.
In the context of our strategic business plan ‘Creating the New’, we aim to further widen our holistic
performance management approach beyond financials. As a consequence, 2016 will see the first initiatives
towards ‘Integrated Performance Management’, which will be the engine to providing more transparency
to all parts of our business for even better decision-making and further enhancing true value creation.
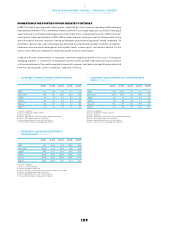
02KEY FINANCIAL METRICS
1 Excluding acquisitions and finance leases.
Gross margin Gross profit
= × 100
Net sales
Operating margin Operating profit
= × 100
Net sales
Average operating
working capital
Sum of operating working
capital at quarter-end
=
4
Net cash/net borrowings =
Cash and cash equivalents
+ short-term financial assets
– short-term borrowings
– long-term borrowings
Operating working capital
in % of net sales
Average operating
working capital
= × 100
Net sales
Capital expenditure 1= Additions of property, plant and
equipment plus intangible assets