Reebok 2015 Annual Report Download - page 136
Download and view the complete annual report
Please find page 136 of the 2015 Reebok annual report below. You can navigate through the pages in the report by either clicking on the pages listed below, or by using the keyword search tool below to find specific information within the annual report.-
 1
1 -
2
-
3
-
4
-
5
-
6
-
7
-
8
-
9
-
10
-
11
-
12
-
13
-
14
-
15
-
16
-
17
-
18
-
19
-
20
-
21
-
22
-
23
-
24
-
25
-
26
-
27
-
28
-
29
-
30
-
31
-
32
-
33
-
34
-
35
-
36
-
37
-
38
-
39
-
40
-
41
-
42
-
43
-
44
-
45
-
46
-
47
-
48
-
49
-
50
-
51
-
52
-
53
-
54
-
55
-
56
-
57
-
58
-
59
-
60
-
61
-
62
-
63
-
64
-
65
-
66
-
67
-
68
-
69
-
70
-
71
-
72
-
73
-
74
-
75
-
76
-
77
-
78
-
79
-
80
-
81
-
82
-
83
-
84
-
85
-
86
-
87
-
88
-
89
-
90
-
91
-
92
-
93
-
94
-
95
-
96
-
97
-
98
-
99
-
100
-
101
-
102
-
103
-
104
-
105
-
106
-
107
-
108
-
109
-
110
-
111
-
112
-
113
-
114
-
115
-
116
-
117
-
118
-
119
-
120
-
121
-
122
-
123
-
124
-
125
-
 126
126 -
 127
127 -
 128
128 -
 129
129 -
 130
130 -
 131
131 -
 132
132 -
 133
133 -
 134
134 -
 135
135 -
 136
136 -
 137
137 -
 138
138 -
 139
139 -
 140
140 -
 141
141 -
 142
142 -
 143
143 -
 144
144 -
 145
145 -
 146
146 -
147
-
148
-
149
-
150
-
151
-
152
-
153
-
154
-
155
-
156
-
157
-
158
-
159
-
160
-
161
-
162
-
163
-
164
-
165
-
166
-
167
-
168
-
169
-
170
-
171
-
172
-
173
-
174
-
175
-
176
-
177
-
178
-
179
-
180
-
181
-
182
-
183
-
184
-
185
-
186
-
187
-
188
-
189
-
190
-
191
-
192
-
193
-
194
-
195
-
196
-
197
-
198
-
199
-
200
-
201
-
202
-
203
-
204
-
205
-
206
-
207
-
208
-
209
-
210
-
211
-
212
-
213
-
214
-
215
-
216
-
217
-
218
-
219
-
220
-
221
-
222
-
223
-
224
-
225
-
226
-
227
-
228
-
229
-
230
-
231
-
232
-
233
-
234
-
235
-
236
-
237
-
238
-
239
-
240
-
241
-
242
-
243
-
244
-
245
-
246
-
247
-
248
-
249
-
250
-
251
-
252
-
253
-
254
-
255
-
256
-
257
-
258
-
259
-
260
-
261
-
262
-
263
-
264
-
265
-
266
-
267
-
268
-
269
-
270
 |
 |

132
3
GROUP MANAGEMENT REPORT – FINANCIAL REVIEW
Group Business Performance – Financial Statements and Management Report of adidas AG
FINANCIAL RESULT IMPROVES SIGNIFICANTLY
The financial result of adidas AG improved to € 394 million in 2015 from € 128 million in 2014. This increase
was due to higher income from investments in affiliated companies in an amount of € 436 million (2014:
€ 170 million).
Net interest expense of adidas AG rose 28% to € 56 million in 2015 (2014: € 44 million). This development
was mainly attributable to higher interest expenses from long-term liabilities towards third parties.
NET INCOME INCREASES STRONGLY
Income from ordinary activities improved 190% to € 716 million in 2015 from € 247 million in 2014. This
was mainly due to the improved operating profit and higher financial result. Net income, after taxes of
€ 78 million, amounted to € 639 million in 2015 and was thus significantly above the prior year level (2014:
€ 176 million).
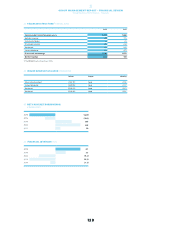
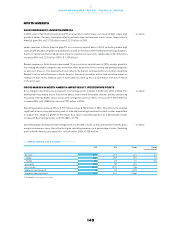
BALANCE SHEET
see Table 48
50BALANCE SHEET IN ACCORDANCE WITH HGB CONDENSED 1€ IN MILLIONS
Dec. 31, 2015 Dec. 31, 2014
Assets
Intangible assets 118 129
Property, plant and equipment 449 419
Financial assets 4,216 3,503
Fixed assets 4,783 4,051
Inventories 48 38
Receivables and other assets 2,157 2,312
Cash and cash equivalents, securities 447 934
Current assets 2,652 3,284
Prepaid expenses 82 80
Total assets 7,517 7,415
Equity and liabilities
Shareholders’ equity 2,087 2,051
Provisions 445 390
Liabilities and other items 4,985 4,974
Total equity and liabilities 7,517 7,415
1 Rounding differences may arise in totals.