Reebok 2015 Annual Report Download - page 120
Download and view the complete annual report
Please find page 120 of the 2015 Reebok annual report below. You can navigate through the pages in the report by either clicking on the pages listed below, or by using the keyword search tool below to find specific information within the annual report.-
 1
1 -
2
-
3
-
4
-
5
-
6
-
7
-
8
-
9
-
10
-
11
-
12
-
13
-
14
-
15
-
16
-
17
-
18
-
19
-
20
-
21
-
22
-
23
-
24
-
25
-
26
-
27
-
28
-
29
-
30
-
31
-
32
-
33
-
34
-
35
-
36
-
37
-
38
-
39
-
40
-
41
-
42
-
43
-
44
-
45
-
46
-
47
-
48
-
49
-
50
-
51
-
52
-
53
-
54
-
55
-
56
-
57
-
58
-
59
-
60
-
61
-
62
-
63
-
64
-
65
-
66
-
67
-
68
-
69
-
70
-
71
-
72
-
73
-
74
-
75
-
76
-
77
-
78
-
79
-
80
-
81
-
82
-
83
-
84
-
85
-
86
-
87
-
88
-
89
-
90
-
91
-
92
-
93
-
94
-
95
-
96
-
97
-
98
-
99
-
100
-
101
-
102
-
103
-
104
-
105
-
106
-
107
-
108
-
109
-
 110
110 -
 111
111 -
 112
112 -
 113
113 -
 114
114 -
 115
115 -
 116
116 -
 117
117 -
 118
118 -
 119
119 -
 120
120 -
 121
121 -
 122
122 -
 123
123 -
 124
124 -
 125
125 -
 126
126 -
 127
127 -
 128
128 -
 129
129 -
 130
130 -
131
-
132
-
133
-
134
-
135
-
136
-
137
-
138
-
139
-
140
-
141
-
142
-
143
-
144
-
145
-
146
-
147
-
148
-
149
-
150
-
151
-
152
-
153
-
154
-
155
-
156
-
157
-
158
-
159
-
160
-
161
-
162
-
163
-
164
-
165
-
166
-
167
-
168
-
169
-
170
-
171
-
172
-
173
-
174
-
175
-
176
-
177
-
178
-
179
-
180
-
181
-
182
-
183
-
184
-
185
-
186
-
187
-
188
-
189
-
190
-
191
-
192
-
193
-
194
-
195
-
196
-
197
-
198
-
199
-
200
-
201
-
202
-
203
-
204
-
205
-
206
-
207
-
208
-
209
-
210
-
211
-
212
-
213
-
214
-
215
-
216
-
217
-
218
-
219
-
220
-
221
-
222
-
223
-
224
-
225
-
226
-
227
-
228
-
229
-
230
-
231
-
232
-
233
-
234
-
235
-
236
-
237
-
238
-
239
-
240
-
241
-
242
-
243
-
244
-
245
-
246
-
247
-
248
-
249
-
250
-
251
-
252
-
253
-
254
-
255
-
256
-
257
-
258
-
259
-
260
-
261
-
262
-
263
-
264
-
265
-
266
-
267
-
268
-
269
-
270
 |
 |

116
3
GROUP MANAGEMENT REPORT – FINANCIAL REVIEW
Group Business Performance – Income Statement
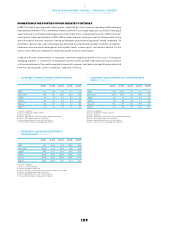
NUMBER OF GROUP EMPLOYEES UP 3%
At the end of 2015, the Group employed 55,555 people. This represents an increase of 3% versus the prior
year level of 53,731. New hirings related to the Group’s global marketing and sales organisation aimed
at further strengthening key growth areas and categories were the main driver of this development.
On a full-time equivalent basis, the number of employees increased 3% to 47,435 at the end of 2015
(2014: 45,917).
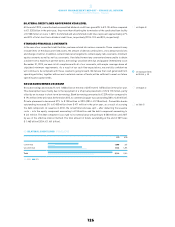
EBITDA INCREASES 15%
The Group’s earnings before interest, taxes, depreciation and amortisation as well as impairment losses/
reversal of impairment losses on property, plant and equipment and intangible assets (EBITDA) increased
15% to € 1.475 billion in 2015 (2014: € 1.283 billion). Depreciation and amortisation expense for tangible
and intangible assets (excluding impairment losses/reversal of impairment losses) was up 10% to
€ 338 million in 2015 (2014: € 309 million). This development is mainly due to an increase in property,
plant and equipment. In accordance with IFRS, intangible assets with indefinite useful lives (goodwill and
trademarks) are tested annually and additionally when there are indications of potential impairment. In
this connection, impairment of intangible assets with unlimited useful lives was incurred in 2015.
GOODWILL IMPAIRMENT IN AN AMOUNTOF € 34 MILLION
The financial year 2015 was impacted by non-operational goodwill impairment losses totalling € 34 million
(2014: € 78 million), mainly related to the company’s Russia/CIS and Latin America cash-generating units.
The impairment losses in both years were non-cash in nature and do not affect the adidas Group’s liquidity.
see Our People, p. 87
see Diagram 19
see Note 13, p. 207
19EBITDA 1, 2€ IN MILLIONS
2015 1,475
2014 1,283
2013 1,496
2012 1,445
2011 1,199
1 2015, 2014 and 2013 reflect continuing operations as a result of the divestiture of the
Rockport business.
2 2011 restated according to IAS 8 in the 2012 consolidated financial statements.