Reebok 2015 Annual Report Download - page 150
Download and view the complete annual report
Please find page 150 of the 2015 Reebok annual report below. You can navigate through the pages in the report by either clicking on the pages listed below, or by using the keyword search tool below to find specific information within the annual report.-
 1
1 -
2
-
3
-
4
-
5
-
6
-
7
-
8
-
9
-
10
-
11
-
12
-
13
-
14
-
15
-
16
-
17
-
18
-
19
-
20
-
21
-
22
-
23
-
24
-
25
-
26
-
27
-
28
-
29
-
30
-
31
-
32
-
33
-
34
-
35
-
36
-
37
-
38
-
39
-
40
-
41
-
42
-
43
-
44
-
45
-
46
-
47
-
48
-
49
-
50
-
51
-
52
-
53
-
54
-
55
-
56
-
57
-
58
-
59
-
60
-
61
-
62
-
63
-
64
-
65
-
66
-
67
-
68
-
69
-
70
-
71
-
72
-
73
-
74
-
75
-
76
-
77
-
78
-
79
-
80
-
81
-
82
-
83
-
84
-
85
-
86
-
87
-
88
-
89
-
90
-
91
-
92
-
93
-
94
-
95
-
96
-
97
-
98
-
99
-
100
-
101
-
102
-
103
-
104
-
105
-
106
-
107
-
108
-
109
-
110
-
111
-
112
-
113
-
114
-
115
-
116
-
117
-
118
-
119
-
120
-
121
-
122
-
123
-
124
-
125
-
126
-
127
-
128
-
129
-
130
-
131
-
132
-
133
-
134
-
135
-
136
-
137
-
138
-
139
-
 140
140 -
 141
141 -
 142
142 -
 143
143 -
 144
144 -
 145
145 -
 146
146 -
 147
147 -
 148
148 -
 149
149 -
 150
150 -
 151
151 -
 152
152 -
 153
153 -
 154
154 -
 155
155 -
 156
156 -
 157
157 -
 158
158 -
 159
159 -
 160
160 -
161
-
162
-
163
-
164
-
165
-
166
-
167
-
168
-
169
-
170
-
171
-
172
-
173
-
174
-
175
-
176
-
177
-
178
-
179
-
180
-
181
-
182
-
183
-
184
-
185
-
186
-
187
-
188
-
189
-
190
-
191
-
192
-
193
-
194
-
195
-
196
-
197
-
198
-
199
-
200
-
201
-
202
-
203
-
204
-
205
-
206
-
207
-
208
-
209
-
210
-
211
-
212
-
213
-
214
-
215
-
216
-
217
-
218
-
219
-
220
-
221
-
222
-
223
-
224
-
225
-
226
-
227
-
228
-
229
-
230
-
231
-
232
-
233
-
234
-
235
-
236
-
237
-
238
-
239
-
240
-
241
-
242
-
243
-
244
-
245
-
246
-
247
-
248
-
249
-
250
-
251
-
252
-
253
-
254
-
255
-
256
-
257
-
258
-
259
-
260
-
261
-
262
-
263
-
264
-
265
-
266
-
267
-
268
-
269
-
270
 |
 |

146
3
GROUP MANAGEMENT REPORT – FINANCIAL REVIEW
Business Performance by Segment – Other Businesses
OTHER BUSINESSES
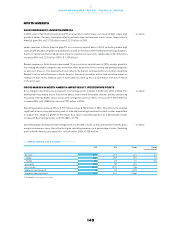
SALES IN OTHER BUSINESSES DECREASE 3%
In 2015, revenues of Other Businesses were down 3% on a currency-neutral basis, as high-single-digit sales
increases at Reebok-CCM Hockey as well as double-digit growth in Other centrally managed businesses
were more than offset by sales declines at TaylorMade-adidas Golf. Currency translation effects positively
impacted revenues in euro terms. Sales of Other Businesses increased 8% to € 1.467 billion (2014:
€ 1.358 billion).
TaylorMade-adidas Golf revenues declined 13% on a currency-neutral basis in 2015. This development was
due to sales decreases in most categories, in particular metalwoods and irons. Currency translation effects
positively impacted TaylorMade-adidas Golf sales in euro terms. Revenues decreased 1% to € 902 million
from € 913 million in the prior year.
Currency-neutral Reebok-CCM Hockey sales were up 8%. This increase was mainly due to strong sales
growth in key categories such as skates and protective equipment. In addition, double-digit increases in
apparel contributed to this development. Currency translation effects positively impacted sales in euro
terms. Reebok-CCM Hockey revenues increased 18% to € 317 million in 2015 from € 269 million in 2014.
Other centrally managed businesses revenues increased 35% on a currency-neutral basis, mainly as a
result of double-digit sales growth at Y-3 and Five Ten. Currency translation effects had a positive impact
on sales in euro terms. Revenues in Other centrally managed businesses increased 38% to € 242 million
in 2015 (2014: € 175 million).
OTHER BUSINESSES DEVELOPMENT BY REGION
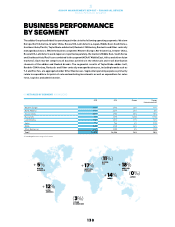
In 2015, currency-neutral sales for Other Businesses were mixed amongst the Group’s regions. Revenues in
Western Europe were up 17% on a currency-neutral basis, driven by strong double-digit sales increases at
both Reebok-CCM Hockey and in Other centrally managed businesses, which more than offset double-digit
sales declines at TaylorMade-adidas Golf. Sales in North America were down 11% on a currency-neutral
basis as sales increases at both Reebok-CCM Hockey and in Other centrally managed businesses were more
than offset by double-digit sales declines at TaylorMade-adidas Golf. In Greater China, revenues decreased
25% on a currency-neutral basis, due to double-digit sales decreases at TaylorMade-adidas Golf. Revenues
in Russia/CIS were down 58% on a currency-neutral basis as a result of double-digit sales declines at both
TaylorMade-adidas Golf and Reebok-CCM Hockey. In Latin America, revenues were up 14% on a currency-
neutral basis, driven by double-digit sales increases at TaylorMade-adidas Golf. Sales in Japan increased
1% on a currency-neutral basis, as strong double-digit growth in Other centrally managed businesses was
partly offset by sales decreases at TaylorMade-adidas Golf. Currency-neutral sales in MEAA were up 7%,
due to high-single-digit sales increases at TaylorMade-adidas Golf, which more than offset sales decreases
in Other centrally managed businesses. With the exception of Russia/CIS, currency translation effects had
a positive impact on regional sales in euro terms.
see Table 09
see Table 10