Reebok 2015 Annual Report Download - page 121
Download and view the complete annual report
Please find page 121 of the 2015 Reebok annual report below. You can navigate through the pages in the report by either clicking on the pages listed below, or by using the keyword search tool below to find specific information within the annual report.-
 1
1 -
2
-
3
-
4
-
5
-
6
-
7
-
8
-
9
-
10
-
11
-
12
-
13
-
14
-
15
-
16
-
17
-
18
-
19
-
20
-
21
-
22
-
23
-
24
-
25
-
26
-
27
-
28
-
29
-
30
-
31
-
32
-
33
-
34
-
35
-
36
-
37
-
38
-
39
-
40
-
41
-
42
-
43
-
44
-
45
-
46
-
47
-
48
-
49
-
50
-
51
-
52
-
53
-
54
-
55
-
56
-
57
-
58
-
59
-
60
-
61
-
62
-
63
-
64
-
65
-
66
-
67
-
68
-
69
-
70
-
71
-
72
-
73
-
74
-
75
-
76
-
77
-
78
-
79
-
80
-
81
-
82
-
83
-
84
-
85
-
86
-
87
-
88
-
89
-
90
-
91
-
92
-
93
-
94
-
95
-
96
-
97
-
98
-
99
-
100
-
101
-
102
-
103
-
104
-
105
-
106
-
107
-
108
-
109
-
110
-
 111
111 -
 112
112 -
 113
113 -
 114
114 -
 115
115 -
 116
116 -
 117
117 -
 118
118 -
 119
119 -
 120
120 -
 121
121 -
 122
122 -
 123
123 -
 124
124 -
 125
125 -
 126
126 -
 127
127 -
 128
128 -
 129
129 -
 130
130 -
 131
131 -
132
-
133
-
134
-
135
-
136
-
137
-
138
-
139
-
140
-
141
-
142
-
143
-
144
-
145
-
146
-
147
-
148
-
149
-
150
-
151
-
152
-
153
-
154
-
155
-
156
-
157
-
158
-
159
-
160
-
161
-
162
-
163
-
164
-
165
-
166
-
167
-
168
-
169
-
170
-
171
-
172
-
173
-
174
-
175
-
176
-
177
-
178
-
179
-
180
-
181
-
182
-
183
-
184
-
185
-
186
-
187
-
188
-
189
-
190
-
191
-
192
-
193
-
194
-
195
-
196
-
197
-
198
-
199
-
200
-
201
-
202
-
203
-
204
-
205
-
206
-
207
-
208
-
209
-
210
-
211
-
212
-
213
-
214
-
215
-
216
-
217
-
218
-
219
-
220
-
221
-
222
-
223
-
224
-
225
-
226
-
227
-
228
-
229
-
230
-
231
-
232
-
233
-
234
-
235
-
236
-
237
-
238
-
239
-
240
-
241
-
242
-
243
-
244
-
245
-
246
-
247
-
248
-
249
-
250
-
251
-
252
-
253
-
254
-
255
-
256
-
257
-
258
-
259
-
260
-
261
-
262
-
263
-
264
-
265
-
266
-
267
-
268
-
269
-
270
 |
 |

117
3
GROUP MANAGEMENT REPORT – FINANCIAL REVIEW
Group Business Performance – Income Statement
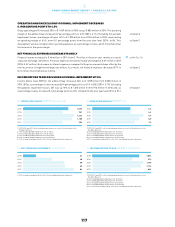
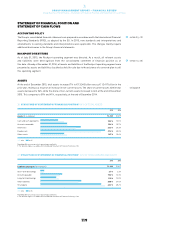
OPERATING MARGIN EXCLUDING GOODWILL IMPAIRMENT DECREASES
0.1 PERCENTAGE POINTSTO 6.5%
Group operating profit increased 20% to € 1.059 billion in 2015 versus € 883 million in 2014. The operating
margin of the adidas Group increased 0.2 percentage points to 6.3% (2014: 6.1%). Excluding the goodwill
impairment losses, operating profit grew 14% to € 1.094 billion from € 961 million in 2014, representing
an operating margin of 6.5%, down 0.1 percentage points from the prior year level (2014: 6.6%). This
development was due to higher other operating expenses as a percentage of sales, which more than offset
the increase in the gross margin.
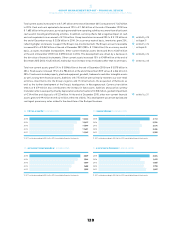
NET FINANCIAL EXPENSES DECREASE STRONGLY
Financial income increased to € 46 million in 2015 from € 19 million in the prior year, mainly as a result
of positive exchange rate effects. Financial expenses remained virtually unchanged at € 67 million in 2015
(2014: € 67 million). An increase in interest expenses compared to the prior year period was offset by the
non-recurrence of negative exchange rate effects. As a result, net financial expenses decreased 57% to
€ 21 million from € 48 million in 2014.
INCOME BEFORE TAXES EXCLUDING GOODWILL IMPAIRMENT UP 18%
Income before taxes (IBT) for the adidas Group increased 24% to € 1.039 billion from € 835 million in
2014. IBT as a percentage of sales increased 0.4 percentage points to 6.1% in 2015 (2014: 5.7%). Excluding
the goodwill impairment losses, IBT was up 18% to € 1.073 billion from € 913 million in 2014 and, as
a percentage of sales, increased 0.1 percentage points to 6.3% compared to the prior year level (2014: 6.3%).
see Diagram 20
see Diagram 21
see Diagram 22
see Note 33, p. 236
see Diagram 23
20OPERATING PROFIT 1, 2, 3, 4, 5, 6€ IN MILLIONS
2015 1,094
2014 961
2013 1,233
2012 1,185
2011 953
1 2015, 2014 and 2013 reflect continuing operations as a result of the divestiture of the
Rockport business.
2 2015 exluding goodwill impairment of € 34 million.
3 2014 exluding goodwill impairment of € 78 million.
4 2013 excluding goodwill impairment of € 52 million.
5 2012 excluding goodwill impairment of € 265 million.
6 2011 restated according to IAS 8 in the 2012 consolidated financial statements.
21OPERATING MARGIN 1, 2, 3, 4, 5, 6IN %
2015 6.5
2014 6.6
2013 8.7
2012 8.0
2011 7.2
1 2015, 2014 and 2013 reflect continuing operations as a result of the divestiture of the
Rockport business.
2 2015 exluding goodwill impairment of € 34 million.
3 2014 exluding goodwill impairment of € 78 million.
4 2013 excluding goodwill impairment of € 52 million.
5 2012 excluding goodwill impairment of € 265 million.
6 2011 restated according to IAS 8 in the 2012 consolidated financial statements.
22NET FINANCIAL EXPENSES 1€ IN MILLIONS
2015 21
2014 48
2013 68
2012 69
2011 84
1 2011 restated according to IAS 8 in the 2012 consolidated financial statements.
23INCOME BEFORE TAXES 1, 2, 3, 4, 5, 6€ IN MILLIONS
2015 1,073
2014 913
2013 1,165
2012 1,116
2011 869
1 2015, 2014 and 2013 reflect continuing operations as a result of the divestiture of the
Rockport business.
2 2015 exluding goodwill impairment of € 34 million.
3 2014 exluding goodwill impairment of € 78 million.
4 2013 excluding goodwill impairment of € 52 million.
5 2012 excluding goodwill impairment of € 265 million.
6 2011 restated according to IAS 8 in the 2012 consolidated financial statements.