Reebok 2015 Annual Report Download - page 90
Download and view the complete annual report
Please find page 90 of the 2015 Reebok annual report below. You can navigate through the pages in the report by either clicking on the pages listed below, or by using the keyword search tool below to find specific information within the annual report.-
 1
1 -
2
-
3
-
4
-
5
-
6
-
7
-
8
-
9
-
10
-
11
-
12
-
13
-
14
-
15
-
16
-
17
-
18
-
19
-
20
-
21
-
22
-
23
-
24
-
25
-
26
-
27
-
28
-
29
-
30
-
31
-
32
-
33
-
34
-
35
-
36
-
37
-
38
-
39
-
40
-
41
-
42
-
43
-
44
-
45
-
46
-
47
-
48
-
49
-
50
-
51
-
52
-
53
-
54
-
55
-
56
-
57
-
58
-
59
-
60
-
61
-
62
-
63
-
64
-
65
-
66
-
67
-
68
-
69
-
70
-
71
-
72
-
73
-
74
-
75
-
76
-
77
-
78
-
79
-
 80
80 -
 81
81 -
 82
82 -
 83
83 -
 84
84 -
 85
85 -
 86
86 -
 87
87 -
 88
88 -
 89
89 -
 90
90 -
 91
91 -
 92
92 -
 93
93 -
 94
94 -
 95
95 -
 96
96 -
 97
97 -
 98
98 -
 99
99 -
 100
100 -
101
-
102
-
103
-
104
-
105
-
106
-
107
-
108
-
109
-
110
-
111
-
112
-
113
-
114
-
115
-
116
-
117
-
118
-
119
-
120
-
121
-
122
-
123
-
124
-
125
-
126
-
127
-
128
-
129
-
130
-
131
-
132
-
133
-
134
-
135
-
136
-
137
-
138
-
139
-
140
-
141
-
142
-
143
-
144
-
145
-
146
-
147
-
148
-
149
-
150
-
151
-
152
-
153
-
154
-
155
-
156
-
157
-
158
-
159
-
160
-
161
-
162
-
163
-
164
-
165
-
166
-
167
-
168
-
169
-
170
-
171
-
172
-
173
-
174
-
175
-
176
-
177
-
178
-
179
-
180
-
181
-
182
-
183
-
184
-
185
-
186
-
187
-
188
-
189
-
190
-
191
-
192
-
193
-
194
-
195
-
196
-
197
-
198
-
199
-
200
-
201
-
202
-
203
-
204
-
205
-
206
-
207
-
208
-
209
-
210
-
211
-
212
-
213
-
214
-
215
-
216
-
217
-
218
-
219
-
220
-
221
-
222
-
223
-
224
-
225
-
226
-
227
-
228
-
229
-
230
-
231
-
232
-
233
-
234
-
235
-
236
-
237
-
238
-
239
-
240
-
241
-
242
-
243
-
244
-
245
-
246
-
247
-
248
-
249
-
250
-
251
-
252
-
253
-
254
-
255
-
256
-
257
-
258
-
259
-
260
-
261
-
262
-
263
-
264
-
265
-
266
-
267
-
268
-
269
-
270
 |
 |

GROUP MANAGEMENT REPORT – OUR GROUP
Research and Development
86
2
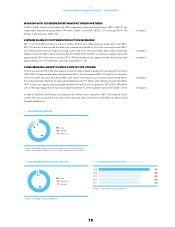
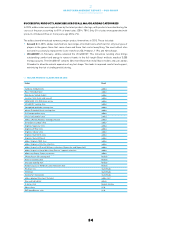
REEBOK-CCM HOCKEY INNOVATES IN STICKSAND SKATES
At Reebok-CCM Hockey, products launched in 2015 accounted for 59% of global sales (2014: 60%). Only
13% of sales were generated with products introduced three or more years ago (2014: 16%).
Reebok-CCM Hockey product launches in 2015 included:
•RBZ Speedburner stick: As the latest addition to the RBZ stick franchise, the RBZ Speedburner was
launched in 2015, based on collaboration between CCM and TaylorMade. In addition to CCM’s proven
Speed Pocket technology, the stick features the new Power Hosel construction, which increases shot
power through better loading and energy transfer.
•
Ribcor skate: With the launch of the Ribcor 50K Pump Skate, CCM released an innovative product
which integrates Reebok’s pump technology in CCM’s traditional Ribcor skate line. The brand strongly
promoted the new product on digital and social media platforms, meeting with very positive response
from the ice hockey world.
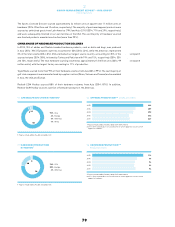
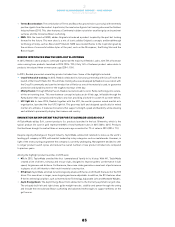
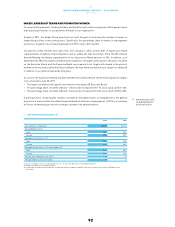
R&D EXPENSES INCREASE 10%
R&D expenses include expenses for personnel and administration, but exclude other costs, for example
those associated with the design aspect of the product creation process. In 2015, as in prior years, all
R&D costs were expensed as incurred. adidas Group R&D expenses increased 10% to € 139 million from
€ 126 million in the prior year.
As our R&D departments comprise experienced and multi-skilled people from different areas of technical
expertise and from diverse cultural backgrounds, personnel expenses represent the largest portion of
R&D expenses, accounting for almost 75% of total R&D expenditure. The number of people employed in
the Group’s R&D activities at December 31, 2015, was 993, compared to 985 employees in the prior year.
This represents 2% of total Group employees.
In 2015, R&D expenses represented 1.9% of other operating expenses (2014: 2.0%). R&D expenses as a
percentage of sales remained relatively stable at 0.8% (2014: 0.9%).
see Table 03
03KEY R&D METRICS 1, 2
2015 2014 2013 2012 2011
R&D expenses (€ in millions) 139 126 124 128 115
R&D expenses (in % of net sales) 0.8 0.9 0.9 0.9 0.9
R&D expenses (in % of other
operating expenses) 1.9 2.0 2.0 2.1 2.1
R&D employees 993 985 992 1,035 1,029
1 2015, 2014 and 2013 reflect continuing operations as a result of the divestiture of the Rockport business.
2 2011 restated according to IAS 8.