Reebok 2015 Annual Report Download - page 239
Download and view the complete annual report
Please find page 239 of the 2015 Reebok annual report below. You can navigate through the pages in the report by either clicking on the pages listed below, or by using the keyword search tool below to find specific information within the annual report.-
 1
1 -
2
-
3
-
4
-
5
-
6
-
7
-
8
-
9
-
10
-
11
-
12
-
13
-
14
-
15
-
16
-
17
-
18
-
19
-
20
-
21
-
22
-
23
-
24
-
25
-
26
-
27
-
28
-
29
-
30
-
31
-
32
-
33
-
34
-
35
-
36
-
37
-
38
-
39
-
40
-
41
-
42
-
43
-
44
-
45
-
46
-
47
-
48
-
49
-
50
-
51
-
52
-
53
-
54
-
55
-
56
-
57
-
58
-
59
-
60
-
61
-
62
-
63
-
64
-
65
-
66
-
67
-
68
-
69
-
70
-
71
-
72
-
73
-
74
-
75
-
76
-
77
-
78
-
79
-
80
-
81
-
82
-
83
-
84
-
85
-
86
-
87
-
88
-
89
-
90
-
91
-
92
-
93
-
94
-
95
-
96
-
97
-
98
-
99
-
100
-
101
-
102
-
103
-
104
-
105
-
106
-
107
-
108
-
109
-
110
-
111
-
112
-
113
-
114
-
115
-
116
-
117
-
118
-
119
-
120
-
121
-
122
-
123
-
124
-
125
-
126
-
127
-
128
-
129
-
130
-
131
-
132
-
133
-
134
-
135
-
136
-
137
-
138
-
139
-
140
-
141
-
142
-
143
-
144
-
145
-
146
-
147
-
148
-
149
-
150
-
151
-
152
-
153
-
154
-
155
-
156
-
157
-
158
-
159
-
160
-
161
-
162
-
163
-
164
-
165
-
166
-
167
-
168
-
169
-
170
-
171
-
172
-
173
-
174
-
175
-
176
-
177
-
178
-
179
-
180
-
181
-
182
-
183
-
184
-
185
-
186
-
187
-
188
-
189
-
190
-
191
-
192
-
193
-
194
-
195
-
196
-
197
-
198
-
199
-
200
-
201
-
202
-
203
-
204
-
205
-
206
-
207
-
208
-
209
-
210
-
211
-
212
-
213
-
214
-
215
-
216
-
217
-
218
-
219
-
220
-
221
-
222
-
223
-
224
-
225
-
226
-
227
-
228
-
 229
229 -
 230
230 -
 231
231 -
 232
232 -
 233
233 -
 234
234 -
 235
235 -
 236
236 -
 237
237 -
 238
238 -
 239
239 -
 240
240 -
 241
241 -
 242
242 -
 243
243 -
 244
244 -
 245
245 -
 246
246 -
 247
247 -
 248
248 -
 249
249 -
250
-
251
-
252
-
253
-
254
-
255
-
256
-
257
-
258
-
259
-
260
-
261
-
262
-
263
-
264
-
265
-
266
-
267
-
268
-
269
-
270
 |
 |

235
4
CONSOLIDATED FINANCIAL STATEMENTS
Notes – Notes to the Consolidated Income Statement
NOTESTOTHE CONSOLIDATED INCOME STATEMENT
All figures related to the 2014 and 2015 financial years in the ‘Notes to the consolidated income statement’
refer to the Group’s continuing operations unless otherwise stated.
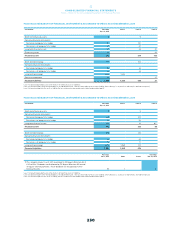
Other operating income consists of the following:
OTHER OPERATING INCOME
€ in millions Year ending
Dec. 31, 2015
Year ending
Dec. 31, 2014
Income from release of accrued liabilities and other provisions 50 89
Income from accounts receivable previously written off 4 3
Gains from disposal of fixed assets 1 2
Reversals of impairment losses for intangible and tangible assets 1 1
Sundry income 42 44
Other operating income 96 138
Sundry income mainly relates to income from cost reimbursements.
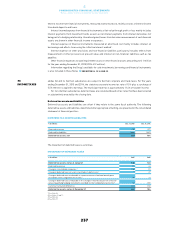
Other operating expenses include expenses for sales, marketing, research and development, as well as
for logistics and central administration. In addition, they include impairment losses as well as depreciation
of tangible assets and amortisation of intangible assets (except goodwill impairment losses), with the
exception of depreciation and amortisation which is included in the cost of sales.
Expenditure for marketing investments is a material component of other operating expenses. The
expenditure for marketing investments consists of promotion and communication spending such as
promotion contracts, advertising, events and other communication activities. However, it does not include
marketing overhead expenses, which are presented in marketing overheads. In 2015, expenditure for
marketing investments accounted for 26% (2014: 25%) of the total other operating expenses.
Expenses for central administration include the functions IT, Finance, Legal, Human Resources,
Facilities & Services as well as General Management.
Depreciation and amortisation expense for tangible and intangible assets (except goodwill impairment
losses) and impairment losses were € 357 million and € 325 million for the years ending December 31,
2015 and 2014, respectively. Thereof, € 3 million and € 2 million were recorded within the cost of sales as
they are directly assigned to the production costs.
OTHER OPERATING EXPENSES
€ in millions Year ending
Dec. 31, 2015
Year ending
Dec. 31, 2014
Expenditure for marketing investments 1,886 1,548
Expenditure for point-of-sale investments 462 375
Marketing overhead 1554 427
Sales force 12,040 1,915
Logistics 1859 763
Research and development 1139 126
Central administration 11,350 1,050
Other operating expenses 7,289 6,203
Thereof: depreciation, amortisation and impairment losses 354 323
1 Including personnel and administration expenses.
30
OTHER OPERATING
INCOME
31
OTHER OPERATING
EXPENSES