Reebok 2015 Annual Report Download - page 131
Download and view the complete annual report
Please find page 131 of the 2015 Reebok annual report below. You can navigate through the pages in the report by either clicking on the pages listed below, or by using the keyword search tool below to find specific information within the annual report.-
 1
1 -
2
-
3
-
4
-
5
-
6
-
7
-
8
-
9
-
10
-
11
-
12
-
13
-
14
-
15
-
16
-
17
-
18
-
19
-
20
-
21
-
22
-
23
-
24
-
25
-
26
-
27
-
28
-
29
-
30
-
31
-
32
-
33
-
34
-
35
-
36
-
37
-
38
-
39
-
40
-
41
-
42
-
43
-
44
-
45
-
46
-
47
-
48
-
49
-
50
-
51
-
52
-
53
-
54
-
55
-
56
-
57
-
58
-
59
-
60
-
61
-
62
-
63
-
64
-
65
-
66
-
67
-
68
-
69
-
70
-
71
-
72
-
73
-
74
-
75
-
76
-
77
-
78
-
79
-
80
-
81
-
82
-
83
-
84
-
85
-
86
-
87
-
88
-
89
-
90
-
91
-
92
-
93
-
94
-
95
-
96
-
97
-
98
-
99
-
100
-
101
-
102
-
103
-
104
-
105
-
106
-
107
-
108
-
109
-
110
-
111
-
112
-
113
-
114
-
115
-
116
-
117
-
118
-
119
-
120
-
 121
121 -
 122
122 -
 123
123 -
 124
124 -
 125
125 -
 126
126 -
 127
127 -
 128
128 -
 129
129 -
 130
130 -
 131
131 -
 132
132 -
 133
133 -
 134
134 -
 135
135 -
 136
136 -
 137
137 -
 138
138 -
 139
139 -
 140
140 -
 141
141 -
142
-
143
-
144
-
145
-
146
-
147
-
148
-
149
-
150
-
151
-
152
-
153
-
154
-
155
-
156
-
157
-
158
-
159
-
160
-
161
-
162
-
163
-
164
-
165
-
166
-
167
-
168
-
169
-
170
-
171
-
172
-
173
-
174
-
175
-
176
-
177
-
178
-
179
-
180
-
181
-
182
-
183
-
184
-
185
-
186
-
187
-
188
-
189
-
190
-
191
-
192
-
193
-
194
-
195
-
196
-
197
-
198
-
199
-
200
-
201
-
202
-
203
-
204
-
205
-
206
-
207
-
208
-
209
-
210
-
211
-
212
-
213
-
214
-
215
-
216
-
217
-
218
-
219
-
220
-
221
-
222
-
223
-
224
-
225
-
226
-
227
-
228
-
229
-
230
-
231
-
232
-
233
-
234
-
235
-
236
-
237
-
238
-
239
-
240
-
241
-
242
-
243
-
244
-
245
-
246
-
247
-
248
-
249
-
250
-
251
-
252
-
253
-
254
-
255
-
256
-
257
-
258
-
259
-
260
-
261
-
262
-
263
-
264
-
265
-
266
-
267
-
268
-
269
-
270
 |
 |

127
3
GROUP MANAGEMENT REPORT – FINANCIAL REVIEW
Group Business Performance – Treasury
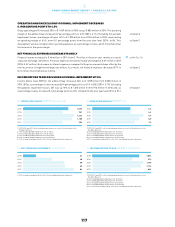
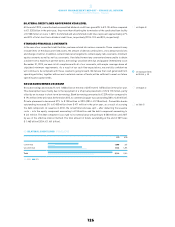
EURO DOMINATES CURRENCY MIX
The vast majority of our Group’s gross borrowings are denominated in euros and US dollars. At the end of
2015, gross borrowings denominated in euros accounted for 80% of total gross borrowings (2014: 80%).
The share of gross borrowings held in US dollars increased to 15% (2014: 12%).
STABLE DEBT MATURITY PROFILE
Over the course of 2015, the Group’s financing maturity profile remained stable. In 2016, assuming
unchanged maturities, debt instruments of € 366 million will mature. This compares to € 288 million
which matured during the course of 2015.
NET DEBT POSITION OF € 460 MILLION
The Group ended the year with a net debt position of € 460 million, compared to a net debt position of
€ 185 million at the end of the prior year, representing an increase of € 275 million. During 2015, we
utilised cash for the second tranche of our share buyback programme in an amount of € 301 million, which
contributed to the higher net debt position.
see Diagram 41
see Diagram 42
see Diagram 45
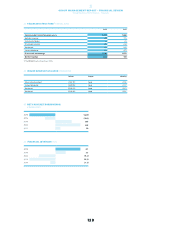
41CURRENCYSPLITOF GROSS BORROWINGS€ IN MILLIONS
2015 2014
EUR 1,463 1,491
USD 282 218
All others 85 164
Total 1,830 1,873
■
2014
■
2015
42REMAININGTIME TO MATURITYOF GROSS BORROWINGS€ IN MILLIONS
2015 2014
< 1 year 366 288
1 to 3 years 483 594
3 to 5 years ––
> 5 years 981 990
Total 1,830 1,873
■
2014
■
2015