Reebok 2015 Annual Report Download - page 52
Download and view the complete annual report
Please find page 52 of the 2015 Reebok annual report below. You can navigate through the pages in the report by either clicking on the pages listed below, or by using the keyword search tool below to find specific information within the annual report.-
 1
1 -
2
-
3
-
4
-
5
-
6
-
7
-
8
-
9
-
10
-
11
-
12
-
13
-
14
-
15
-
16
-
17
-
18
-
19
-
20
-
21
-
22
-
23
-
24
-
25
-
26
-
27
-
28
-
29
-
30
-
31
-
32
-
33
-
34
-
35
-
36
-
37
-
38
-
39
-
40
-
41
-
 42
42 -
 43
43 -
 44
44 -
 45
45 -
 46
46 -
 47
47 -
 48
48 -
 49
49 -
 50
50 -
 51
51 -
 52
52 -
 53
53 -
 54
54 -
 55
55 -
 56
56 -
 57
57 -
 58
58 -
 59
59 -
 60
60 -
 61
61 -
 62
62 -
63
-
64
-
65
-
66
-
67
-
68
-
69
-
70
-
71
-
72
-
73
-
74
-
75
-
76
-
77
-
78
-
79
-
80
-
81
-
82
-
83
-
84
-
85
-
86
-
87
-
88
-
89
-
90
-
91
-
92
-
93
-
94
-
95
-
96
-
97
-
98
-
99
-
100
-
101
-
102
-
103
-
104
-
105
-
106
-
107
-
108
-
109
-
110
-
111
-
112
-
113
-
114
-
115
-
116
-
117
-
118
-
119
-
120
-
121
-
122
-
123
-
124
-
125
-
126
-
127
-
128
-
129
-
130
-
131
-
132
-
133
-
134
-
135
-
136
-
137
-
138
-
139
-
140
-
141
-
142
-
143
-
144
-
145
-
146
-
147
-
148
-
149
-
150
-
151
-
152
-
153
-
154
-
155
-
156
-
157
-
158
-
159
-
160
-
161
-
162
-
163
-
164
-
165
-
166
-
167
-
168
-
169
-
170
-
171
-
172
-
173
-
174
-
175
-
176
-
177
-
178
-
179
-
180
-
181
-
182
-
183
-
184
-
185
-
186
-
187
-
188
-
189
-
190
-
191
-
192
-
193
-
194
-
195
-
196
-
197
-
198
-
199
-
200
-
201
-
202
-
203
-
204
-
205
-
206
-
207
-
208
-
209
-
210
-
211
-
212
-
213
-
214
-
215
-
216
-
217
-
218
-
219
-
220
-
221
-
222
-
223
-
224
-
225
-
226
-
227
-
228
-
229
-
230
-
231
-
232
-
233
-
234
-
235
-
236
-
237
-
238
-
239
-
240
-
241
-
242
-
243
-
244
-
245
-
246
-
247
-
248
-
249
-
250
-
251
-
252
-
253
-
254
-
255
-
256
-
257
-
258
-
259
-
260
-
261
-
262
-
263
-
264
-
265
-
266
-
267
-
268
-
269
-
270
 |
 |
TO OUR SHAREHOLDERS
Our Share
48
1
In addition, the financial objectives outlined during the day were positively perceived by the financial
community and were above market expectations.
At the beginning of the second quarter, the adidas AG share continued its positive trend, supported by
subsequent management roadshow activities. On May 5, the adidas Group released strong first quarter
results which were above market expectations. However, the overall negative market sentiment resulting
from ongoing concerns with regard to a Greek default weighed on both the adidas AG share and international
equity markets during the day and for the remainder of the second quarter. On June 24, the adidas Group
held its first IR Tutorial Workshop. While the event was very well received by market participants, the adidas
AG share was not able to escape the overall negative market sentiment.
At the beginning of the third quarter of 2015, extensive roadshow activities as well as positive analyst
commentary prior to the adidas Group’s first half results release provided positive stimulus to the share
price in July. While the publication of the adidas Group’s first half results was positively perceived by market
participants, the adidas AG share came under pressure from mid-August onwards, reflecting the overall
challenging market environment caused by weakening economic data from China. During the first half of
September, the adidas AG share stabilised and traded sideways, supported by positive company-specific
as well as sector-related newsflow. On November 5, following the publication of a very strong set of third
quarter results, together with increased guidance for the 2015 financial year and a better-than-expected
initial outlook for 2016, the adidas AG share rose 9% during the day. Subsequent management roadshows
and positive analyst feedback provided further momentum to the share price, resulting in a new all-time
high of € 93.41 on December 2. The remaining weeks of December were characterised by macroeconomic
uncertainties as well as profit taking by some investors. As a result, the adidas AG share closed 2015 at
€ 89.91, representing a 56% increase over the year and making the adidas AG share the top performer of
the DAX-30. This implies a market capitalisation of € 18.0 billion at the end of 2015 versus € 11.8 billion
at the end of 2014.
see Table 03
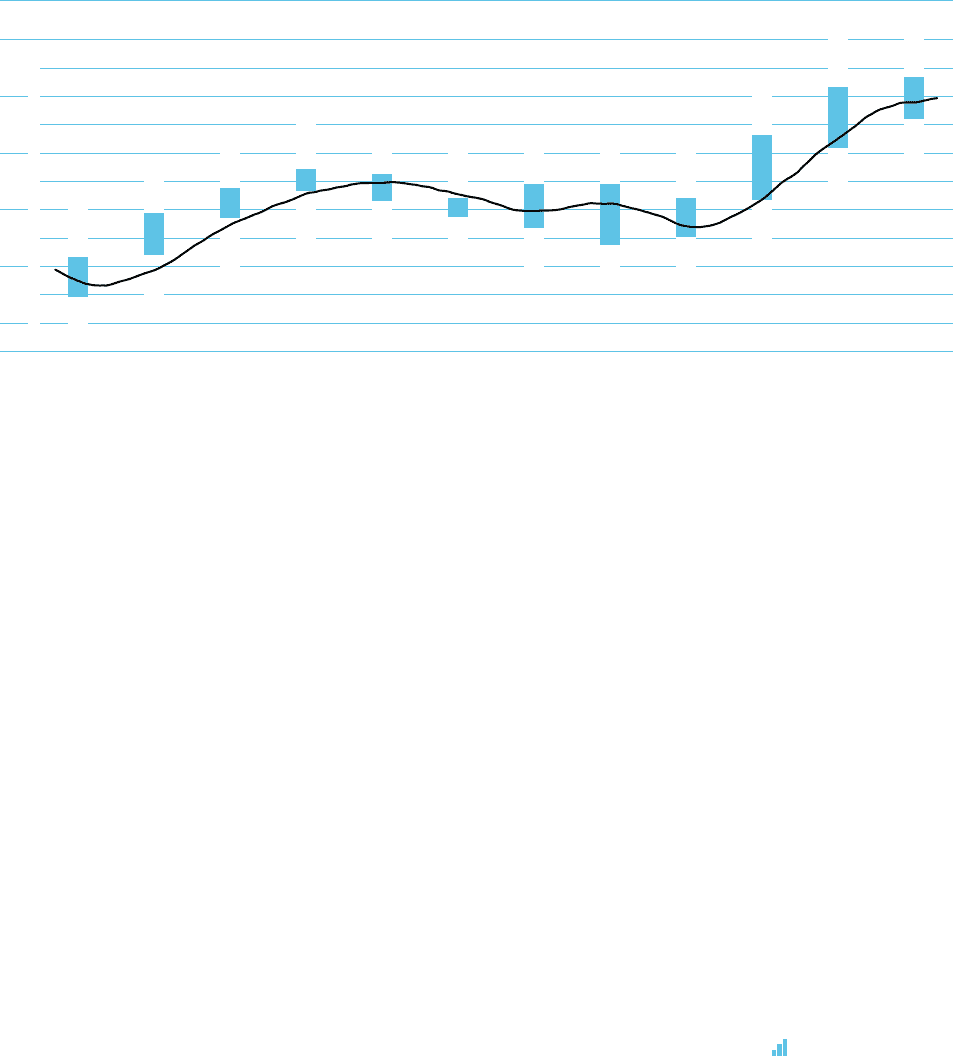
042015 ADIDASAG HIGH AND LOW SHARE PRICES PER MONTH 1IN €
| Jan. Feb. Mar. Apr. May Jun. Jul. Aug. Sep. Oct. Nov. Dec. |
90
80
70
60
50
—
30- day moving average
■
High and low share prices Source: Bloomberg.
1 Based on daily Xetra closing prices.
61.57
69.43
73.80
77.21
76.33
72.09
74.47
74.48
72.01
83.20
91.59
93.41
54.61
61.79
68.44
73.25
71.53
68.65
66.80
63.68
65.18
71.70
80.80
85.93