Reebok 2015 Annual Report Download - page 162
Download and view the complete annual report
Please find page 162 of the 2015 Reebok annual report below. You can navigate through the pages in the report by either clicking on the pages listed below, or by using the keyword search tool below to find specific information within the annual report.-
 1
1 -
 2
2 -
 3
3 -
 4
4 -
 5
5 -
 6
6 -
 7
7 -
 8
8 -
 9
9 -
 10
10 -
 11
11 -
 12
12 -
 13
13 -
 14
14 -
 15
15 -
 16
16 -
 17
17 -
 18
18 -
 19
19 -
 20
20 -
 21
21 -
 22
22 -
 23
23 -
 24
24 -
 25
25 -
 26
26 -
 27
27 -
 28
28 -
 29
29 -
 30
30 -
 31
31 -
 32
32 -
 33
33 -
 34
34 -
 35
35 -
 36
36 -
 37
37 -
 38
38 -
 39
39 -
 40
40 -
 41
41 -
 42
42 -
 43
43 -
 44
44 -
 45
45 -
 46
46 -
 47
47 -
 48
48 -
 49
49 -
 50
50 -
 51
51 -
 52
52 -
 53
53 -
 54
54 -
 55
55 -
 56
56 -
 57
57 -
 58
58 -
 59
59 -
 60
60 -
 61
61 -
 62
62 -
 63
63 -
 64
64 -
 65
65 -
 66
66 -
 67
67 -
 68
68 -
 69
69 -
 70
70 -
 71
71 -
 72
72 -
 73
73 -
 74
74 -
 75
75 -
 76
76 -
 77
77 -
 78
78 -
 79
79 -
 80
80 -
 81
81 -
 82
82 -
 83
83 -
 84
84 -
 85
85 -
 86
86 -
 87
87 -
 88
88 -
 89
89 -
 90
90 -
 91
91 -
 92
92 -
 93
93 -
 94
94 -
 95
95 -
 96
96 -
 97
97 -
 98
98 -
 99
99 -
 100
100 -
 101
101 -
 102
102 -
 103
103 -
 104
104 -
 105
105 -
 106
106 -
 107
107 -
 108
108 -
 109
109 -
 110
110 -
 111
111 -
 112
112 -
 113
113 -
 114
114 -
 115
115 -
 116
116 -
 117
117 -
 118
118 -
 119
119 -
 120
120 -
 121
121 -
 122
122 -
 123
123 -
 124
124 -
 125
125 -
 126
126 -
 127
127 -
 128
128 -
 129
129 -
 130
130 -
 131
131 -
 132
132 -
 133
133 -
 134
134 -
 135
135 -
 136
136 -
 137
137 -
 138
138 -
 139
139 -
 140
140 -
 141
141 -
 142
142 -
 143
143 -
 144
144 -
 145
145 -
 146
146 -
 147
147 -
 148
148 -
 149
149 -
 150
150 -
 151
151 -
 152
152 -
 153
153 -
 154
154 -
 155
155 -
 156
156 -
 157
157 -
 158
158 -
 159
159 -
 160
160 -
 161
161 -
 162
162 -
 163
163 -
 164
164 -
 165
165 -
 166
166 -
 167
167 -
 168
168 -
 169
169 -
 170
170 -
 171
171 -
 172
172 -
 173
173 -
 174
174 -
 175
175 -
 176
176 -
 177
177 -
 178
178 -
 179
179 -
 180
180 -
 181
181 -
 182
182 -
 183
183 -
 184
184 -
 185
185 -
 186
186 -
 187
187 -
 188
188 -
 189
189 -
 190
190 -
 191
191 -
 192
192 -
 193
193 -
 194
194 -
 195
195 -
 196
196 -
 197
197 -
 198
198 -
 199
199 -
 200
200 -
 201
201 -
 202
202 -
 203
203 -
 204
204 -
 205
205 -
 206
206 -
 207
207 -
 208
208 -
 209
209 -
 210
210 -
 211
211 -
 212
212 -
 213
213 -
 214
214 -
 215
215 -
 216
216 -
 217
217 -
 218
218 -
 219
219 -
 220
220 -
 221
221 -
 222
222 -
 223
223 -
 224
224 -
 225
225 -
 226
226 -
 227
227 -
 228
228 -
 229
229 -
 230
230 -
 231
231 -
 232
232 -
 233
233 -
 234
234 -
 235
235 -
 236
236 -
 237
237 -
 238
238 -
 239
239 -
 240
240 -
 241
241 -
 242
242 -
 243
243 -
 244
244 -
 245
245 -
 246
246 -
 247
247 -
 248
248 -
 249
249 -
 250
250 -
 251
251 -
 252
252 -
 253
253 -
 254
254 -
 255
255 -
 256
256 -
 257
257 -
 258
258 -
 259
259 -
 260
260 -
 261
261 -
 262
262 -
 263
263 -
 264
264 -
 265
265 -
 266
266 -
 267
267 -
 268
268 -
 269
269 -
 270
270
 |
 |
GROUP MANAGEMENT REPORT – FINANCIAL REVIEW
Risk and Opportunity Report
158
3
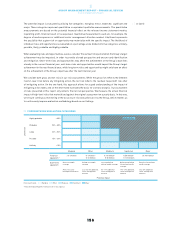
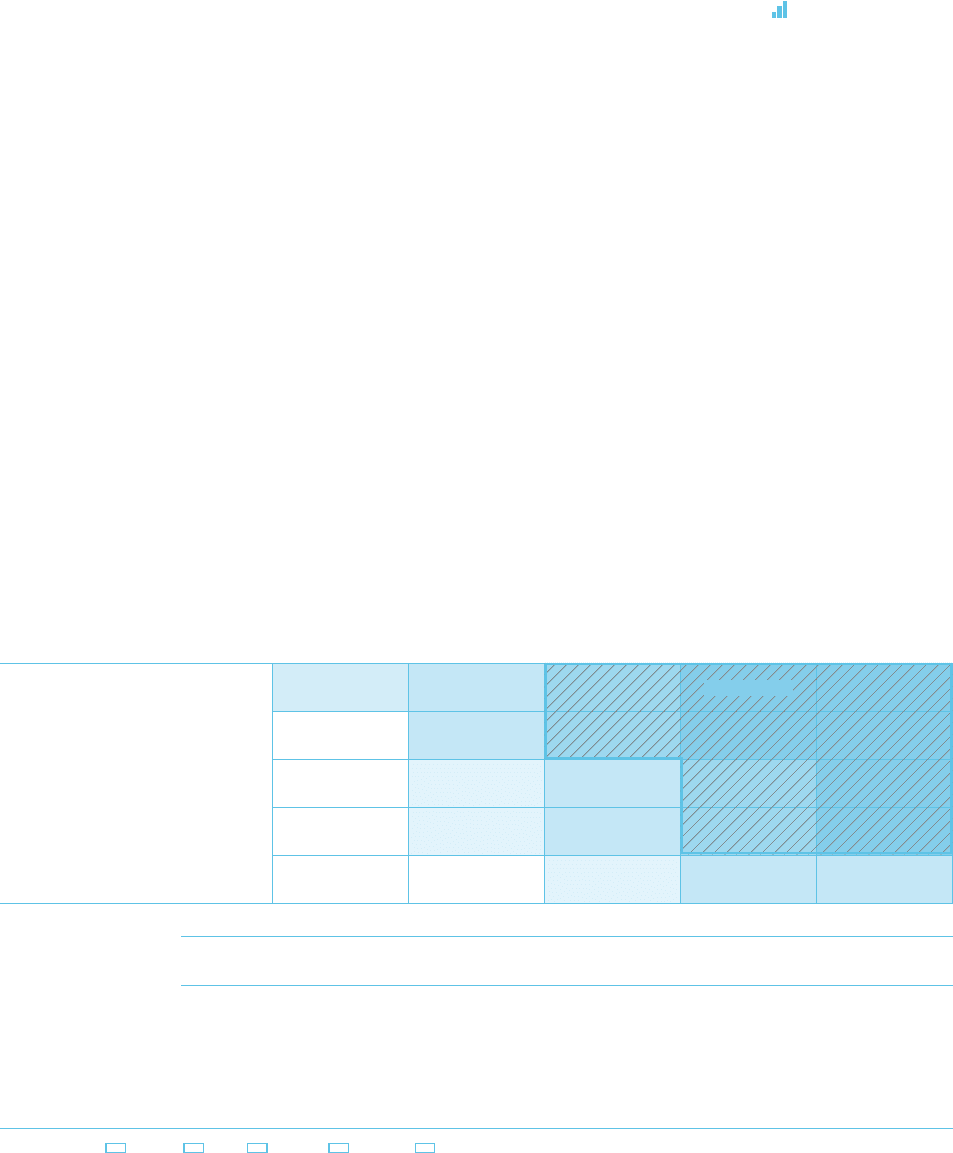
The potential impact is evaluated by utilising five categories: marginal, minor, moderate, significant and
major. These categories represent quantitative or equivalent qualitative measurements. The quantitative
measurements are based on the potential financial effect on the relevant income statement metrics
(operating profit, financial result or tax expenses). Qualitative measurements used are, for example, the
degree of media exposure or additional senior management attention needed. Likelihood represents
the possibility that a given risk or opportunity may materialise with the specific impact. The likelihood of
individual risks and opportunities is evaluated on a percentage scale divided into five categories: unlikely,
possible, likely, probable and highly probable.
When evaluating risks and opportunities, we also consider the earliest time period when the Group’s target
achievement may be impacted, in order to provide a broad perspective and ensure early identification
and mitigation. Short-term risks and opportunities may affect the achievement of the Group’s objectives
already in the current financial year, mid-term risks and opportunities would impact the Group’s target
achievement in the next financial year, while long-term risks and opportunities might only have an effect
on the achievement of the Group’s objectives after the next financial year.
We consider both gross and net risks in our risk assessments. While the gross risk reflects the inherent
(‘worst-case’) risk before any mitigating action, the net risk reflects the residual (‘expected’) risk after
all mitigating action. On the one hand, this approach allows for a good understanding of the impact of
mitigating action taken, and on the other hand it provides the basis for scenario analysis. Our assessment
of risks presented in this report only reflects the net risk perspective. We measure the actual financial
impact of high-level risks that materialised against the original assessment on a yearly basis. In this way,
we ensure continuous monitoring of the accuracy of risk evaluations across the Group, which enables us
to continuously improve evaluation methodology based on our findings.
see Table 02
02CORPORATE RISK EVALUATION CATEGORIES
Likelihood
Highly probable > 85%
Probable 50% – 85%
Likely 30% – 50%
Possible 15% – 30%
Unlikely < 15%
Marginal Minor Moderate Significant Major
Financial
equivalent 1
≤ € 1 million € 1 million –
€ 10 million
€ 10 million –
€ 50 million
€ 50 million –
€ 100 million
≥ € 100 million
Qualitative
equivalent
Almost no media
coverage
Almost no senior
management attention
Limited local media
coverage
Less than 5% additional
senior management
attention
Local and limited
national media coverage
5% – 10% additional
senior management
attention
National and limited
international media
coverage
10% – 20% additional
senior management
attention
Extensive international
media coverage
Over 20% additional
senior management
attention
Potential impact
Risk classification:
■
Marginal
■
Minor
■
Moderate
■
Significant
■
Major
1 Based on operating profit, financial result or tax expenses.
Material risks
