Reebok 2015 Annual Report Download - page 122
Download and view the complete annual report
Please find page 122 of the 2015 Reebok annual report below. You can navigate through the pages in the report by either clicking on the pages listed below, or by using the keyword search tool below to find specific information within the annual report.-
 1
1 -
2
-
3
-
4
-
5
-
6
-
7
-
8
-
9
-
10
-
11
-
12
-
13
-
14
-
15
-
16
-
17
-
18
-
19
-
20
-
21
-
22
-
23
-
24
-
25
-
26
-
27
-
28
-
29
-
30
-
31
-
32
-
33
-
34
-
35
-
36
-
37
-
38
-
39
-
40
-
41
-
42
-
43
-
44
-
45
-
46
-
47
-
48
-
49
-
50
-
51
-
52
-
53
-
54
-
55
-
56
-
57
-
58
-
59
-
60
-
61
-
62
-
63
-
64
-
65
-
66
-
67
-
68
-
69
-
70
-
71
-
72
-
73
-
74
-
75
-
76
-
77
-
78
-
79
-
80
-
81
-
82
-
83
-
84
-
85
-
86
-
87
-
88
-
89
-
90
-
91
-
92
-
93
-
94
-
95
-
96
-
97
-
98
-
99
-
100
-
101
-
102
-
103
-
104
-
105
-
106
-
107
-
108
-
109
-
110
-
111
-
 112
112 -
 113
113 -
 114
114 -
 115
115 -
 116
116 -
 117
117 -
 118
118 -
 119
119 -
 120
120 -
 121
121 -
 122
122 -
 123
123 -
 124
124 -
 125
125 -
 126
126 -
 127
127 -
 128
128 -
 129
129 -
 130
130 -
 131
131 -
 132
132 -
133
-
134
-
135
-
136
-
137
-
138
-
139
-
140
-
141
-
142
-
143
-
144
-
145
-
146
-
147
-
148
-
149
-
150
-
151
-
152
-
153
-
154
-
155
-
156
-
157
-
158
-
159
-
160
-
161
-
162
-
163
-
164
-
165
-
166
-
167
-
168
-
169
-
170
-
171
-
172
-
173
-
174
-
175
-
176
-
177
-
178
-
179
-
180
-
181
-
182
-
183
-
184
-
185
-
186
-
187
-
188
-
189
-
190
-
191
-
192
-
193
-
194
-
195
-
196
-
197
-
198
-
199
-
200
-
201
-
202
-
203
-
204
-
205
-
206
-
207
-
208
-
209
-
210
-
211
-
212
-
213
-
214
-
215
-
216
-
217
-
218
-
219
-
220
-
221
-
222
-
223
-
224
-
225
-
226
-
227
-
228
-
229
-
230
-
231
-
232
-
233
-
234
-
235
-
236
-
237
-
238
-
239
-
240
-
241
-
242
-
243
-
244
-
245
-
246
-
247
-
248
-
249
-
250
-
251
-
252
-
253
-
254
-
255
-
256
-
257
-
258
-
259
-
260
-
261
-
262
-
263
-
264
-
265
-
266
-
267
-
268
-
269
-
270
 |
 |

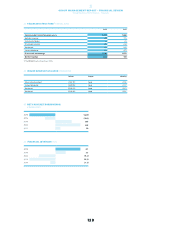
118
3
GROUP MANAGEMENT REPORT – FINANCIAL REVIEW
Group Business Performance – Income Statement
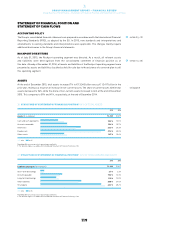
NET INCOME FROM CONTINUING OPERATIONS EXCLUDING GOODWILL IMPAIRMENT
INCREASES 12%
The Group’s net income from continuing operations increased 22% to € 686 million in 2015 from € 564 million
in 2014. Excluding the goodwill impairment losses, net income from continuing operations was up 12% to
€ 720 million (2014: € 642 million). The Group’s tax rate increased 1.5 percentage points to 34.0% in 2015
(2014: 32.5%). Excluding the goodwill impairment losses, the effective tax rate grew 3.2 percentage points
to 32.9% from 29.7% in 2014, mainly due to the non-recognition of deferred tax assets.
LOSSES FROM DISCONTINUED OPERATIONSTOTAL € 46 MILLION
In 2015, the Group incurred losses from discontinued operations of € 46 million, net of tax, related to
the Rockport operating segment (2014: losses of € 68 million). Losses from discontinued operations in
2015 were mainly due to the loss from the sale, net of tax, in the amount of € 32 million and the loss from
Rockport’s operating activities of € 13 million.
NET INCOME ATTRIBUTABLE TO SHAREHOLDERS EXCLUDING GOODWILL
IMPAIRMENT INCREASES 18%
The Group’s net income attributable to shareholders, which in addition to net income from continuing
operations includes the losses from discontinued operations, grew 29% to € 634 million in 2015 from
€ 490 million in 2014. Excluding the goodwill impairment losses, net income attributable to shareholders
was up 18% to € 668 million (2014: € 568 million).
BASICAND DILUTED EPS FROM CONTINUINGAND DISCONTINUED OPERATIONS
EXCLUDING GOODWILL IMPAIRMENT UP 22%
Basic and diluted EPS from continuing and discontinued operations increased 34% to € 3.15 in 2015 (2014:
€ 2.35). Excluding the goodwill impairment losses, basic and diluted EPS from continuing and discontinued
operations increased 22% to € 3.32 from € 2.72 in 2014. The weighted average number of shares used in
the calculation was 201,536,418 (2014: 208,776,457).
see Note 34, p. 237
see Note 03, p. 200
see Diagram 24
see Diagram 25
see Note 35, p. 239
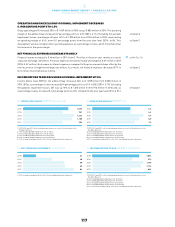
24 NET INCOME ATTRIBUTABLE TO SHARE-
HOLDERS 1, 2, 3, 4, 5, 6€ IN MILLIONS
2015 668
2014 568
2013 839
2012 791
2011 613
1 Includes continuing and discontinued operations.
2 2015 exluding goodwill impairment of € 34 million.
3 2014 exluding goodwill impairment of € 78 million.
4 2013 excluding goodwill impairment of € 52 million.
5 2012 excluding goodwill impairment of € 265 million.
6 2011 restated according to IAS 8 in the 2012 consolidated financial statements.
25 DILUTED EARNINGS PER SHARE 1, 2, 3, 4, 5, 6
IN €
2015 3.32
2014 2.72
2013 4.01
2012 3.78
2011 2.93
1 Includes continuing and discontinued operations.
2 2015 exluding goodwill impairment of € 34 million.
3 2014 exluding goodwill impairment of € 78 million.
4 2013 excluding goodwill impairment of € 52 million.
5 2012 excluding goodwill impairment of € 265 million.
6 2011 restated according to IAS 8 in the 2012 consolidated financial statements.