Reebok 2015 Annual Report Download - page 221
Download and view the complete annual report
Please find page 221 of the 2015 Reebok annual report below. You can navigate through the pages in the report by either clicking on the pages listed below, or by using the keyword search tool below to find specific information within the annual report.-
 1
1 -
2
-
3
-
4
-
5
-
6
-
7
-
8
-
9
-
10
-
11
-
12
-
13
-
14
-
15
-
16
-
17
-
18
-
19
-
20
-
21
-
22
-
23
-
24
-
25
-
26
-
27
-
28
-
29
-
30
-
31
-
32
-
33
-
34
-
35
-
36
-
37
-
38
-
39
-
40
-
41
-
42
-
43
-
44
-
45
-
46
-
47
-
48
-
49
-
50
-
51
-
52
-
53
-
54
-
55
-
56
-
57
-
58
-
59
-
60
-
61
-
62
-
63
-
64
-
65
-
66
-
67
-
68
-
69
-
70
-
71
-
72
-
73
-
74
-
75
-
76
-
77
-
78
-
79
-
80
-
81
-
82
-
83
-
84
-
85
-
86
-
87
-
88
-
89
-
90
-
91
-
92
-
93
-
94
-
95
-
96
-
97
-
98
-
99
-
100
-
101
-
102
-
103
-
104
-
105
-
106
-
107
-
108
-
109
-
110
-
111
-
112
-
113
-
114
-
115
-
116
-
117
-
118
-
119
-
120
-
121
-
122
-
123
-
124
-
125
-
126
-
127
-
128
-
129
-
130
-
131
-
132
-
133
-
134
-
135
-
136
-
137
-
138
-
139
-
140
-
141
-
142
-
143
-
144
-
145
-
146
-
147
-
148
-
149
-
150
-
151
-
152
-
153
-
154
-
155
-
156
-
157
-
158
-
159
-
160
-
161
-
162
-
163
-
164
-
165
-
166
-
167
-
168
-
169
-
170
-
171
-
172
-
173
-
174
-
175
-
176
-
177
-
178
-
179
-
180
-
181
-
182
-
183
-
184
-
185
-
186
-
187
-
188
-
189
-
190
-
191
-
192
-
193
-
194
-
195
-
196
-
197
-
198
-
199
-
200
-
201
-
202
-
203
-
204
-
205
-
206
-
207
-
208
-
209
-
210
-
 211
211 -
 212
212 -
 213
213 -
 214
214 -
 215
215 -
 216
216 -
 217
217 -
 218
218 -
 219
219 -
 220
220 -
 221
221 -
 222
222 -
 223
223 -
 224
224 -
 225
225 -
 226
226 -
 227
227 -
 228
228 -
 229
229 -
 230
230 -
 231
231 -
232
-
233
-
234
-
235
-
236
-
237
-
238
-
239
-
240
-
241
-
242
-
243
-
244
-
245
-
246
-
247
-
248
-
249
-
250
-
251
-
252
-
253
-
254
-
255
-
256
-
257
-
258
-
259
-
260
-
261
-
262
-
263
-
264
-
265
-
266
-
267
-
268
-
269
-
270
 |
 |

217
4
CONSOLIDATED FINANCIAL STATEMENTS
Notes – Notes to the Consolidated Statement of Financial Position
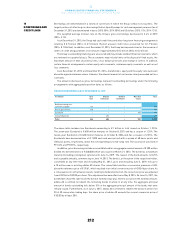
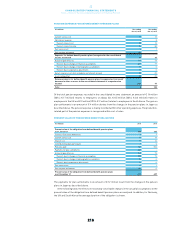
AMOUNTS FOR DEFINED BENEFIT PENSION PLANS RECOGNISED IN THE CONSOLIDATED
STATEMENTOF FINANCIAL POSITION
€ in millions Dec. 31, 2015 Dec. 31, 2014
Present value of funded obligation from defined benefit pension plans 394 391
Fair value of plan assets (173) (157)
Funded status 221 234
Present value of unfunded obligation from defined benefit pension plans 25 37
Asset ceiling effect 0 0
Net defined benefit liability 246 271
Thereof: liability 247 271
Thereof: adidas AG 206 212
Thereof: asset (0) (0)
Thereof: adidas AG – –
The determination of assets and liabilities for defined benefit plans is based upon statistical and actuarial
valuations. In particular, the present value of the defined benefit obligation is driven by financial variables
(such as the discount rates or future increases in salaries) and demographic variables (such as mortality
and employee turnover). The actuarial assumptions may differ significantly from the actual circumstances
and could lead to different cash flows.
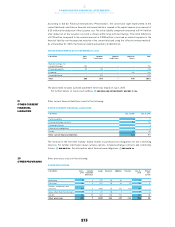
WEIGHTEDAVERAGE ACTUARIAL ASSUMPTIONS
in % Dec. 31, 2015 Dec. 31, 2014
Discount rate 2.8 2.4
Expected rate of salary increases 3.1 3.2
Expected pension increases 1.7 1.7
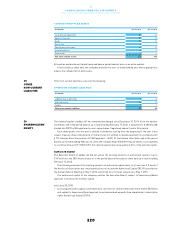
The weighted average actuarial assumptions as at the balance sheet date are used to determine the defined
benefit liability at that date and the pension expense for the upcoming financial year.
The actuarial assumptions for withdrawal and mortality rates are based on statistical information
available in the various countries. In Germany, the Heubeck 2005 G mortality tables are used. In the UK,
assumptions are based on the S1NA base table with modified improvement of the life expectancy mortality
tables. In South Korea, the KIDI 2015 tables from the Korean Insurance Development Institute are used.
As in the previous year, the calculation of the pension liabilities in Germany is based on a discount rate
determined using the ‘Mercer Yield Curve (MYC)’ approach. With effect from June 30, 2015, all relevant
information for deriving the MYC is obtained from a single data provider (Thomson Reuter’s Datastream)
with the result that bond and rating information is sourced from two rating agencies instead of three. If
the discount rate were determined based on the MYC without changes, the discount rate would be higher
by approximately ten basis points and the defined benefit obligation would be approximately € 6 million
lower than the reported defined benefit obligation.
Remeasurements, such as gains or losses arising from changes in the actuarial assumptions for defined
benefit pension plans during the financial year or a return on the plan assets exceeding the interest income,
are immediately recognised outside the income statement as a change in other reserves in the consolidated
statement of comprehensive income.