Reebok 2015 Annual Report Download - page 106
Download and view the complete annual report
Please find page 106 of the 2015 Reebok annual report below. You can navigate through the pages in the report by either clicking on the pages listed below, or by using the keyword search tool below to find specific information within the annual report.-
 1
1 -
2
-
3
-
4
-
5
-
6
-
7
-
8
-
9
-
10
-
11
-
12
-
13
-
14
-
15
-
16
-
17
-
18
-
19
-
20
-
21
-
22
-
23
-
24
-
25
-
26
-
27
-
28
-
29
-
30
-
31
-
32
-
33
-
34
-
35
-
36
-
37
-
38
-
39
-
40
-
41
-
42
-
43
-
44
-
45
-
46
-
47
-
48
-
49
-
50
-
51
-
52
-
53
-
54
-
55
-
56
-
57
-
58
-
59
-
60
-
61
-
62
-
63
-
64
-
65
-
66
-
67
-
68
-
69
-
70
-
71
-
72
-
73
-
74
-
75
-
76
-
77
-
78
-
79
-
80
-
81
-
82
-
83
-
84
-
85
-
86
-
87
-
88
-
89
-
90
-
91
-
92
-
93
-
94
-
95
-
 96
96 -
 97
97 -
 98
98 -
 99
99 -
 100
100 -
 101
101 -
 102
102 -
 103
103 -
 104
104 -
 105
105 -
 106
106 -
 107
107 -
 108
108 -
 109
109 -
 110
110 -
 111
111 -
 112
112 -
 113
113 -
 114
114 -
 115
115 -
 116
116 -
117
-
118
-
119
-
120
-
121
-
122
-
123
-
124
-
125
-
126
-
127
-
128
-
129
-
130
-
131
-
132
-
133
-
134
-
135
-
136
-
137
-
138
-
139
-
140
-
141
-
142
-
143
-
144
-
145
-
146
-
147
-
148
-
149
-
150
-
151
-
152
-
153
-
154
-
155
-
156
-
157
-
158
-
159
-
160
-
161
-
162
-
163
-
164
-
165
-
166
-
167
-
168
-
169
-
170
-
171
-
172
-
173
-
174
-
175
-
176
-
177
-
178
-
179
-
180
-
181
-
182
-
183
-
184
-
185
-
186
-
187
-
188
-
189
-
190
-
191
-
192
-
193
-
194
-
195
-
196
-
197
-
198
-
199
-
200
-
201
-
202
-
203
-
204
-
205
-
206
-
207
-
208
-
209
-
210
-
211
-
212
-
213
-
214
-
215
-
216
-
217
-
218
-
219
-
220
-
221
-
222
-
223
-
224
-
225
-
226
-
227
-
228
-
229
-
230
-
231
-
232
-
233
-
234
-
235
-
236
-
237
-
238
-
239
-
240
-
241
-
242
-
243
-
244
-
245
-
246
-
247
-
248
-
249
-
250
-
251
-
252
-
253
-
254
-
255
-
256
-
257
-
258
-
259
-
260
-
261
-
262
-
263
-
264
-
265
-
266
-
267
-
268
-
269
-
270
 |
 |
GROUP MANAGEMENT REPORT – FINANCIAL REVIEW
Internal Group Management System
102
3
INTERNALGROUP
MANAGEMENTSYSTEM
The adidas Group’s principal financial goal for increasing shareholder value is maximising operating
cash flow. We strive to achieve this goal by continually improving our top- and bottom-line performance
while at the same time optimising the use of invested capital. Our Group’s planning and controlling
system is therefore designed to provide a variety of tools to assess our current performance and
to align future strategic and investment decisions to best utilise commercial and organisational
opportunities.
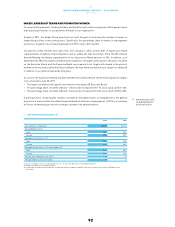
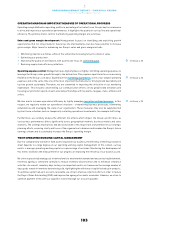
OPERATING CASH FLOW AS INTERNALGROUP MANAGEMENT FOCUS
We believe operating cash flow is the most important driver to increase shareholder value. To support
this, Group Management focuses on four major financial Key Performance Indicators (KPIs). Increasing
net sales and operating profit are the main contributors to improve operating cash flow. In addition, strict
management of operating working capital and value-enhancing capital expenditure are beneficial for
operating cash flow development. As a result, in order to maximise operating cash flow generation across
our organisation, management of our operating segments have responsibility for improving net sales and
operating profit as well as optimising operating working capital and capital expenditure. In addition, in
order to keep senior management focused on long-term performance improvements, we have KPIs in
place, which measure the development of the business units over a multi-year period.
see Glossary, p. 260
see Diagram 01
01FINANCIAL KPIS OF THE ADIDAS GROUP
Net sales
Operating
cash flow
Operating profit
Change in operating working capital
Capital expenditure 1
1 Less depreciation and amortisation.