Reebok 2015 Annual Report Download - page 243
Download and view the complete annual report
Please find page 243 of the 2015 Reebok annual report below. You can navigate through the pages in the report by either clicking on the pages listed below, or by using the keyword search tool below to find specific information within the annual report.-
 1
1 -
2
-
3
-
4
-
5
-
6
-
7
-
8
-
9
-
10
-
11
-
12
-
13
-
14
-
15
-
16
-
17
-
18
-
19
-
20
-
21
-
22
-
23
-
24
-
25
-
26
-
27
-
28
-
29
-
30
-
31
-
32
-
33
-
34
-
35
-
36
-
37
-
38
-
39
-
40
-
41
-
42
-
43
-
44
-
45
-
46
-
47
-
48
-
49
-
50
-
51
-
52
-
53
-
54
-
55
-
56
-
57
-
58
-
59
-
60
-
61
-
62
-
63
-
64
-
65
-
66
-
67
-
68
-
69
-
70
-
71
-
72
-
73
-
74
-
75
-
76
-
77
-
78
-
79
-
80
-
81
-
82
-
83
-
84
-
85
-
86
-
87
-
88
-
89
-
90
-
91
-
92
-
93
-
94
-
95
-
96
-
97
-
98
-
99
-
100
-
101
-
102
-
103
-
104
-
105
-
106
-
107
-
108
-
109
-
110
-
111
-
112
-
113
-
114
-
115
-
116
-
117
-
118
-
119
-
120
-
121
-
122
-
123
-
124
-
125
-
126
-
127
-
128
-
129
-
130
-
131
-
132
-
133
-
134
-
135
-
136
-
137
-
138
-
139
-
140
-
141
-
142
-
143
-
144
-
145
-
146
-
147
-
148
-
149
-
150
-
151
-
152
-
153
-
154
-
155
-
156
-
157
-
158
-
159
-
160
-
161
-
162
-
163
-
164
-
165
-
166
-
167
-
168
-
169
-
170
-
171
-
172
-
173
-
174
-
175
-
176
-
177
-
178
-
179
-
180
-
181
-
182
-
183
-
184
-
185
-
186
-
187
-
188
-
189
-
190
-
191
-
192
-
193
-
194
-
195
-
196
-
197
-
198
-
199
-
200
-
201
-
202
-
203
-
204
-
205
-
206
-
207
-
208
-
209
-
210
-
211
-
212
-
213
-
214
-
215
-
216
-
217
-
218
-
219
-
220
-
221
-
222
-
223
-
224
-
225
-
226
-
227
-
228
-
229
-
230
-
231
-
232
-
 233
233 -
 234
234 -
 235
235 -
 236
236 -
 237
237 -
 238
238 -
 239
239 -
 240
240 -
 241
241 -
 242
242 -
 243
243 -
 244
244 -
 245
245 -
 246
246 -
 247
247 -
 248
248 -
 249
249 -
 250
250 -
 251
251 -
 252
252 -
 253
253 -
254
-
255
-
256
-
257
-
258
-
259
-
260
-
261
-
262
-
263
-
264
-
265
-
266
-
267
-
268
-
269
-
270
 |
 |

239
4
CONSOLIDATED FINANCIAL STATEMENTS
Notes – Notes to the Consolidated Income Statement
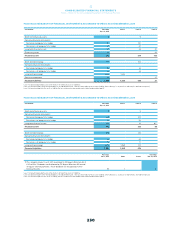
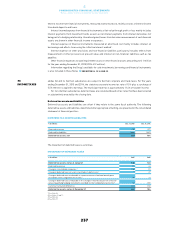
The effective tax rate of the Group differs from an assumed tax rate of 30% for the year ending
December 31, 2015 as follows:
TAX RATE RECONCILIATION
Year ending Dec. 31, 2015 Year ending Dec. 31, 2014
€ in millions in % € in millions in %
Expected income tax expenses 312 30.0 251 30.0
Tax rate differentials (139) (13.4) (117) (14.1)
Non-deductible expenses 35 3.4 18 2.2
Goodwill impairment losses 10 1.0 23 2.8
Losses for which benefits were not recog-
nisable and changes in valuation allowances 95 9.2 42 5.0
Changes in tax rates (21) (2.0) 6 0.7
Other, net 2 0.1 1 0.1
294 28.3 224 26.8
Withholding tax expenses 59 5.7 47 5.6
Income tax expenses 353 34.0 271 32.5
For 2015 and 2014, the effective tax rate is affected by non-tax-deductible goodwill impairment losses.
Excluding the goodwill impairment losses, the effective tax rate is 32.9% and 29.7%, respectively.
For 2015, the line item ‘Losses for which benefits were not recognisable and changes in valuation
allowances’ mainly relates to changes in valuation allowances of the US tax group.
For 2015, the line item ‘Changes in tax rates’ mainly reflects a UK tax rate reduction effective in 2015.
Basic earnings per share from continuing operations are calculated by dividing the net income from
continuing operations attributable to shareholders by the weighted average number of shares outstanding
during the year, excluding ordinary shares purchased by the adidas Group and held as treasury shares.
Basic earnings per share from continuing and discontinued operations are calculated by dividing the
net income attributable to shareholders by the weighted average number of shares outstanding during the
year, excluding ordinary shares purchased by the adidas Group and held as treasury shares.
It is not necessary to include 6.1 million dilutive potential shares arising from the convertible bond
issuance in March 2012 in the calculation of diluted earnings per share in 2015 as the conversion right does
not have any value as at the balance sheet date SEE NOTE 18. The average share price reached € 73.07
per share during 2015 and thus did not exceed the conversion price of € 82.00 per share. As a consequence
of contractual provisions relating to dividend protection, the conversion price was adjusted from € 82.56
to € 82.00 per share. This adjustment became effective on May 8, 2015.
35
EARNINGS PER
SHARE